
Pennsylvania 2045 Long-Range Transportation Plan
Message from the Secretary
Transportation is critical to Pennsylvania's economic vitality and well-being. We see that theme across history, and it holds true today in a time of transformative change. Now, enabled by technology and driven by data, the Commonwealth's transportation system can become more efficient, responsive, sustainable, resilient, and equitable than ever before.
Pennsylvania's 2045 Long-Range Transportation Plan (LRTP) outlines a future transportation system that Pennsylvanians are creating together.
Transportation agencies provide facilities and services essential to everyday life. As such, we must be able to react effectively to abrupt changes and urgent situations, such as those thrust upon us by the COVID-19 pandemic and the relentless impacts of climate change. The Pennsylvania Department of Transportation (PennDOT) makes investments in roadways, bridges, public transit, and other infrastructure that last decades, and must do so with a strategic future perspective that considers big-picture outcomes for the Commonwealth's transportation system and its users.
The plan's goals are inspiring and were developed based on broad engagement with diverse stakeholders, the public, and underrepresented interests, which is the cornerstone of the planning process. This resulted in wide-ranging and valuable feedback, so much so that a major goal and objectives specific to addressing equity are a key part of the LRTP.
Our ability to achieve these goals—even with the extensive collaboration with our partners and stakeholders—depends upon securing adequate resources. Implementing strong investment proposals like that put forward by the Transportation Revenue Options Commission1 will be essential for advancing much of this plan.
Under any funding scenario, collaborating with other agencies, other levels of government, the private sector, MPOs/RPOs, and the public is vital to making positive, systemwide improvements. I am pleased with the diverse engagement that has occurred with such partners, with the aim of collaborative implementation to accomplish common purposes.
Transportation is about fostering opportunity. We must make wise investments in our infrastructure and services that yield great returns, opening opportunities for all Pennsylvanians. As stewards of the statewide transportation system, that mindset is at the heart of this plan and our commitment to implementing its strategic actions and initiatives. We are embracing new tools, skills, processes, and perspectives to accomplish this plan.
A special thank you to the many individuals who provided input during the plan's development. We ask that all Pennsylvanians remain involved as we implement the plan's action strategies and initiatives that will strengthen our transportation system, programs, and services long into the future.
LRTP Strategic Directions Summary
The plan's six goals and objectives are listed below.
- Safety
- Enhance safety and security for both motorized and non-motorized modes throughout Pennsylvania's transportation system.
- Continue to promote behavioral change through existing educational initiatives with partners and stakeholders that encourage safe habits for users of all modes.
- Reduce the rate and frequency of fatal and serious injury crashes for all modes of travel.
- Expand the collection of transportation safety data and explore funding sources for safety and data analysis for use in systemwide planning, programming, project development, and project delivery.
- Strengthen security across transportation modes in collaboration with public and private stakeholders.
- Mobility
- Strengthen transportation mobility to meet the increasingly dynamic needs of Pennsylvania residents, businesses, and visitors.
- Continue to improve system efficiency and reliability.
- Continue to improve public transportation awareness, access, and services throughout Pennsylvania.
- Provide and prioritize multimodal transportation choices to meet user needs, expand mobility options, and increase multimodal system capacity and connectivity.
- Implement regional transportation, land use standards, and tools that result in improved multimodal coordination and complementary development.
- Adapt to changing travel demands, including those associated with e-commerce and post-COVID-19 pandemic changes.
- Work with private sector partners to establish data standards for mobility services and their applications (e.g., Uber and Lyft, carsharing services, bikeshares, etc.)
- Equity
- Improve transportation access and equity throughout Pennsylvania.
- Evaluate transportation equity issues and opportunities across Pennsylvania.
- Develop measurable goals and metrics for equitable transportation in collaboration with key stakeholder groups.
- Establish equity and access strategies in partnership with stakeholder organizations
- and groups that advance the identified measurable goals.
- Improve equity and accessibility through ADA improvements and modal choice.
- Develop education, awareness, and training initiatives that strengthen transportation professionals' knowledge and skills to effectively address equity issues and opportunities.
- Implement and support public transportation initiatives for affordability, reliability, and availability for the transit-dependent population.
- Resilience
- Strengthen Pennsylvania transportation's resilience to climate change and other risks and reduce transportation's environmental impacts.
- Employ resiliency measures/actions to ensure long-term system stability.
- Evaluate projects for their expected climate change and resiliency impact and implications
- Improve environmental stewardship during and before project construction.
- Performance
- Improve the condition and performance of transportation assets.
- Leverage technology, operations enhancements, and skill building to improve transportation system efficiency.
- Continue to integrate enhanced asset management approaches and methods with project planning and programming.
- Enhance the availability and quality of real-time travel information, especially in emergency and inclement weather events and for construction/work zones.
- Expand and/or build upon existing technical assistance and education to local communities and MPOs/RPOs.
- Identify potential new public transportation performance measures including value-based, quality-of-life measures demonstrating the difference public transportation makes in the lives of people, including access to employment.
- Resources
- Structure transportation funding and finance approaches that allocate sufficient resources for system safety, maintenance, preservation, and improvement.
- Advance a multimodal and state-local funding strategy to ensure that resource levels are sufficient to meet transportation system needs.
- Adapt to and position for accelerating change (e.g., mainstreaming innovation, institutional adjustments, people skills, and knowledge management).
- Streamline planning and public involvement processes.
- Improve planning and analytical tools to adapt to changes impacting transportation, including the implementation of a data repository and information exchanges within PennDOT (between Bureaus/Divisions, between Central Office and Districts, etc.).
Transportation Planning in 2020 and Beyond
Development of the 2045 Long Range Transportation Plan (LRTP) and Freight Movement Plan (FMP) began in 2019. In early 2020, the entire nation experienced a period of disruptive change beginning with the onset of the COVID-19 Pandemic.
Transportation planning for both the short- and long-term was forced to accommodate these changes as the demand for a safe, efficient and reliable transportation system became essential to all citizens in Pennsylvania as well as across the nation.
In late 2021, federal legislation was passed to address the investment need in the nation's infrastructure. PennDOT and its partners are working diligently to assign these dollars to projects across the Commonwealth. There has also been significant advances in vehicle electrification technology with ambitious goals for widespread adoption as well as ongoing advancements in artificial intelligence, robotics, and related transformative technologies.
With transportation conditions and needs changing so rapidly, what is the value of a long-range plan, and how do we keep it relevant when we can't see over the horizon?
Long-Range Goals for Continuity
Long-range transportation planning is especially valuable because of rapid near-term change. Instead of merely reacting and constantly changing course, adhering to a consistent long-term vision enables systematic progress. This is especially true given the multi-year nature of transportation project development, from planning through design and construction to ongoing maintenance.
The goals associated with the LRTP articulate what aspects of transportation are important to Pennsylvanians, and what broad types of outcomes are desired over the 20-year planning horizon. For example, safety will always be a priority, even though advances in automated vehicles may change PennDOT's activities toward enhancing transportation safety.
Near-Term Actions for Adaptation
Although the LRTP is based on rigorous analysis of trends and likely future conditions, no doubt new issues and influences will arise over the coming years. This reality is accommodated by the implementation approach. PennDOT's LRTP Action Plan—which identifies, schedules, and tracks individual tasks that will advance the plan's goals and objectives over the next five years—will be monitored and modified as appropriate to ensure that activity is strategically adapted to address changing needs and opportunities.
The LRTP is considered a “living document” to be adjusted as conditions warrant, with the aim of ensuring that Pennsylvania mobility is poised to meet dynamic needs for decades to come.
Table of Contents
Context: What, Why, How, and Who
- Long-Range Transportation Plan Essentials
- Public & Stakeholder Involvement
- Public Comment Period
Existing Conditions and Trends: Where We Are Now
- Highlights by Mode
- Additional Opportunities
Strategic Directions: Where We Need to Be
- Goals and Objectives
Implementation: How We Will Get There
- Overview
- Actions and Accountability
- Implementation Partners and Projects
- Transportation Performance Management
- Implementation Resource: Transportation Planning Data Repository
Context: What, Why, How, and Who
Long-Range Transportation Plan Essentials
The statewide long-range transportation plan (LRTP) establishes a direction for Pennsylvania's transportation system, for across a 20-year planning horizon. That direction is expressed as the goals and objectives that will guide our programs and project investments.
This 2045 PA LRTP has been developed alongside a PA Freight Movement Plan (FMP). The two plans complement each other, establishing a comprehensive direction for enhancing the movement of people and goods within and through the state.
The statewide LRTP does not include specific projects, such as bridge replacements or major road improvements. These projects are developed regionally by the state's metropolitan and rural planning organizations (MPOs/RPOs), known as PennDOT's Planning Partners. Each MPO/RPO develops a regional LRTP in step with the statewide direction. See Figure 26 for a map of Pennsylvania's MPO/RPO regions.
LRTP Elements:
- Interstate Highway System
- Non-Interstate Roadway Network
- Bridges
- Traffic Operations
- Freight
- Public Transportation
- Passenger Rail
- Active Transportation
- Aviation
- Connected and Automated Vehicles (CAV)
PennDOT produces modal and functional plans that relate to the LRTP, including:
- Active Transportation Plan
- Aviation System Plan
- Freight Movement Plan
- State Rail Plan
- Strategic Highway Safety Plan
- Regional Operations Plans
More background on Pennsylvania Transportation planning - history and process - is provided in Appendix A, available at: penndot.gov/planning.
Transportation Planning Process
Long-range planning is one of three key phases of transportation improvement. Plans guide development of Transportation Improvement Programs (TIP) established at the regional level. The TIP projects are rolled up into a Statewide Transportation Improvement Program (or STIP) and included in the statewide 12-Year Program (TYP), which is updated every two years.
In the off-year, the State Transportation Commission (STC) and Transportation Advisory Committee (TAC) compile a Transportation Performance Report (TPR), which serves as a report card on the transportation system and helps direct future programming to achieve plan goals. It is a cornerstone of the TYP development process.
The update of both the LRTP and 12-Year Program include extensive outreach to the public and transportation stakeholders to ensure that public perspectives are considered as part of the process.
Planning: Sets Direction
- Long-Range Transportation Plan (LRTP) 20-Year Plan (Updated every 6-10 years)
- Where do we want to go?
- Goals
- Objectives
- Measures
- How are we going to get there?
- Implementation Strategies
- Policies
- Priorities
- Functional Plans
- MPO/RPO LRTPs
Programming: Prioritizes Projects
- 12-Year Program (TYP)
- How can we best use available funding?
- Lists funded projects for a 12-year period
- First four-year period is the Statewide Transportation Improvement Program (STIP)
- STIP complies MPO/RPO Transportation Improvement Programs (TIP)
Performance Measurement: Measures Progress
Public & Stakeholder Involvement
Many voices throughout the Commonwealth provided the foundation for effective development and successful implementation of Pennsylvania's 2045 LRTP. The scope and scale of outreach conducted for the LRTP was greater than for any previous plan. The users of the statewide transportation network provide an essential perspective in helping to shape the plan's strategic directions.
To capture transportation system needs and concerns across Pennsylvania, input was solicited in various forums and incorporated at key points during plan development. In addition to statewide public outreach and stakeholder engagement, extensive “in-reach” was a key element of the stakeholder engagement process. PennDOT units and partnering agencies and organizations were engaged to ensure that current and future initiatives would be properly reflected and supported by the LRTP's implementation plan.
Engagement Highlights
Public Outreach
- Public Surveys Completed: 7,400
- Public Forum Views: 1,905
- E-News Contacts: 2,700
- Social Media Posts: 11
Stakeholder Engagement
- MPOs and RPOs Engaged: 24
- State Transportation Commission & Transportation Advisory Committee Presentations: 8
- Freight Focus Group Meetings by Mode: 5
- Freight Forum Registrations: 225
- Equity & Diversity Workshops Attendance: 25
- PennDOT Planning Network e-Blasts: 9
- State Planning Board Attendance: 49
PennDOT In-reach & Interagency Collaboration
- Executive Interviews: 35
- PennDOT Bureaus/Districts Engaged: >40
- Partnering Agency Interviews & Presentations: 5
Public Comment Period
Public & Stakeholder Involvement
The success and implementation of the LRTP strongly depends on public and stakeholder involvement and participation. Feedback was requested on the draft plans through the Public Comment Period from September 20 – October 19, 2021.
Significant effort was made to maximize public outreach during the comment period, through social media, email campaigns and targeting underserved populations such as senior citizens, people with disabilities, and marginalized communities. Additional measures were taken to bridge the digital divide in rural communities across the state by having Pennsylvania public libraries serve as access points to the digital and printed plans for review and comment. Opportunity for feedback was also given to Federally Recognized Tribes to better understand how the plans will impact their community now and in the future.
Public Comment Period Outreach by the Numbers
Social Media
Significant effort was made to maximize public outreach and awareness during the comment period through Facebook, Twitter, Instagram, and LinkedIn. Targeted social media posts were used to reach underserved populations such as senior citizens, people with disabilities, and marginalized communities.
Total Posts: 7
Reach*: 183,392
Impressions*: 287,733
Engagement*: 26,436
Stakeholder Email Campaign
Internal and external stakeholders were engaged through several email newsletters sent by PennDOT Planning Network eNews.
Emails Sent: 6
Stakeholder Database: 8,083
Average Open Rate: 32.6%
New Newsletter Sign-ups: 53
Public Comment Period Website
The Public Comment Period website was made available for public review on the PennDOT Planning and Talk PA Transportation websites. The plans were also made available in PDF and text-only formats and accompanied by comment forms for public to use to provide their feedback.
Total Page Views: 2,230
Public Library Access
Additional measures were taken to bridge the digital gap in rural communities statewide by having Pennsylvania public libraries serve as access points to the digital and printed plans for review and comment.
Libraries received printed copies of the plans: 618
Post-Comment Period Survey to Public Libraries: 42
Tribal Outreach
Opportunity for feedback was also offered to Federally Recognized Tribes with ancestral ties to Pennsylvania to better understand how the plans will impact their community now and in the future.
17 Federally Recognized Tribes received hard copies of the plans and links to the digital versions.
*Social Media Definitions
- Reach is the number of people who saw any content from the PennDOT page or about the PennDOT page.
- Impressions are the number of times any content from PennDOT or about PennDOT entered a person's screen.
- Engagement is any action someone takes on PennDOT's page or one of PennDOT's posts.
Statewide Virtual Freight Forum
A major milestone for the stakeholder engagement process was the Statewide Virtual Freight Forum. It convened over 175 stakeholders from across the state and nation to discuss the dynamics of the freight industry, explore current trends, and offer feedback on a recommended future direction.
Key themes emerging from the forum were:
- Freight networks are critically important to the supply chain which moves essential raw materials as well as finished goods.
- Issues such as truck parking will become more challenging as our reliance on goods movement continues to grow.
- Trending issues such as automated vehicles, the explosive growth of e-commerce, and changing supply-chain patterns are poised to affect our planning.
- It is imperative to reduce the impact of transportation on our changing climate.
- We must abide by the value of fairness in working to meet the transportation needs of all our communities and citizens.
Executive Interviews: Key Themes
Several common themes emerged from interviews of agency executives at the start of the planning process, including:
- Transportation and land use connection
- Emerging technology
- Asset management
- Equitable solutions for diverse populations, from urban to rural areas
- Multimodal and intermodal connections
- Transportation's impact on quality of life
- Stronger connections between planning and programming
- Funding to support plan outcomes
- Implementation and accountability
Municipal Collaboration
The following organizations offered local government viewpoints during statewide plan development:
- Pennsylvania State Association of Boroughs (representing 956 boroughs, statewide)
- County Commissioners Association of Pennsylvania (67 counties)
- Pennsylvania State Association of Township Supervisors (1,546 townships)
- Pennsylvania Municipal League (119 members)
- Pennsylvania State Association of Township Commissioners (93 first class townships)
STC TYP Public Survey
Public feedback was obtained through an online public survey and public forum hosted by PennDOT and the STC for the 2023 12-Year Program update. Extensive outreach and promotions were launched through the STC website, including e-mail blasts to thousands of stakeholders, a targeted social media campaign offered in Spanish and Mandarin—the two most-spoken languages in Pennsylvania after English, traditional media outreach, and outreach in partnership with stakeholders.
PennDOT will continue to use the STC online public survey process to inform the 12-Year Program and future LRTP updates. Future surveys will include recurring questions (to draw important comparisons and trends, over time) as well as new questions to obtain the public's opinions on Pennsylvania's changing transportation conditions.
Survey Results: Transportation Priorities
7,400 respondents completed a public survey and ranked their transportation priorities in the following order:
- Road Pavement: Repairing, restoring, reconstructing, and maintaining state and local roads
- Bridges: Repairing, replacing, and maintaining state and local bridges
- Traffic Flow: Adding new lanes, constructing new roads, and using technology to improve traffic flow
- Interstate Highways: Prioritizing Interstate reconstruction investments with numerous specific projects identified
- Walking: Accessible and connected walking routes
- Public Transportation: Accessible and frequent public transportation options that cover an extensive service area and cross regions
- Passenger Rail: Intercity and commuter rail service with out-of-state connections
- Bicycling: Safe routes and facilities throughout the state
- Freight: Modern highways, railways, airports, and ports to support the economy
- Aviation: Modern facilities, operations, and a wide range of commercial airline choices
Existing Conditions and Trends:
Where We are Now
Demographics
Trends & Issues
- With a 2020 population of just over 13 million, Pennsylvania remains one of the most populous states in the nation, ranking fifth in size. Pennsylvania's economy, were it a single country, would be the 25th-largest in the world, just behind Belgium and Taiwan.
- Most of Pennsylvania's population growth has occurred within its southeastern (Philadelphia) and southcentral (Harrisburg) regions. Cumberland and Lebanon counties have led the state in growth rates since 2010, while Philadelphia, Montgomery, and Lancaster counties experienced the greatest population gains numerically (Figure 1).
- Pennsylvania's growth rate since the 2010 U.S. Census (2.4 percent) is well below the national average (7.4 percent). Among the 50 states, Pennsylvania ranked 44th in rate of population growth since 2010. By 2050, the state's population is forecasted to exceed 13.3 million (Figure 2).
- Of Pennsylvania's 67 counties, 46 had population declines over the past decade, with the steepest losses occurring in the western counties of Cambria, Erie, and Westmoreland.
- Growth in the state's townships continues to far outpace that of more densely populated cities and boroughs. Roughly 56 percent of the state's population resides in one of the state's 1,546 townships.
- Pennsylvania has one of the nation's largest populations of rural residents. Just over a quarter of the state's residents (3.5 million as of 2021) live in one of the state's 48 rural counties.
- Every day, an estimated 500 Pennsylvania residents turn 65. By 2030 all Baby Boomers (those born between 1946 and 1964) will be age 65 or older, comprising 23 percent of the state's population (compared to just 15 percent in 2010). This share is expected to remain steady through 2050 due to mortality rates.
- Millennials, or those born between 1981 and 1996, now outnumber Baby Boomers and are Pennsylvania's largest demographic group. This technology-driven generation came of age during the rise of the Internet and is more accepting of technology and technological change than previous generations.
- Pennsylvania is also more racially diverse. By 2050, the state's non-white population is expected to increase 13 percent, while the white population is expected to decline by the same rate. Pennsylvania's youth are more diverse than the state's adult population (age 20 and older).
Planning Implications
- Despite being a “slow growth” state, Pennsylvania is a large consumer market in the Northeastern U.S., with strong demand for travel by people and freight on its transportation system. Ongoing changes in demographics will affect where and how transportation infrastructure and services must adapt to accommodate demand. Serving the mobility and access needs of urban and rural residents and businesses will continue to be an important challenge.
- The confluence of a growing number of older Pennsylvanians, coupled with a greater desire of Millennials and Generation Z (born between 1997 and 2012) for good connections to community destinations, affordable homes, and mixed-use development sites with residences, workplaces, shopping, and restaurants in close proximity, means that local communities will need to place a greater emphasis on walkability, and micromobility, and adopt zoning that encourages and helps facilitate multimodal approaches to address transportation needs.
- Technology continues to change at an accelerating rate, and at a pace that has been further propelled by the COVID-19 pandemic (e.g., home package delivery). The “creative disruption” of the pandemic spurred the adoption of technology, particularly by younger generations, and will continue to fuel an ongoing evolution in the development of connected and automated vehicles, embrace of e-commerce, and interest in “smart city” projects.
Figure 1: Population Change, 2010 to 2020
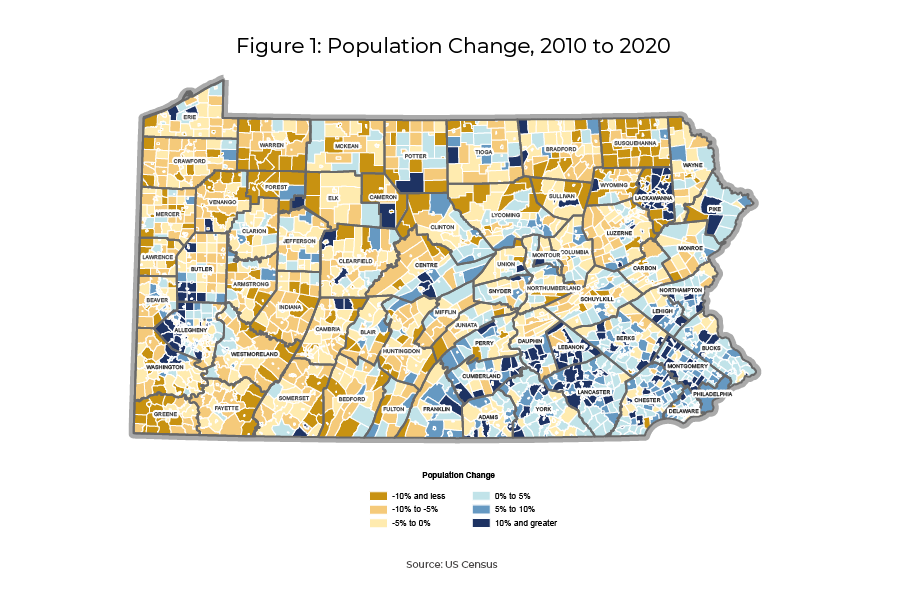
Figure 1 illustrates data from the U.S. Census in a map of Pennsylvania color-coded to depict the percentage of population change in municipalities across the state between 2010 and 2020.
Figure 2: Forecasted Population Change, 2020 to 2050
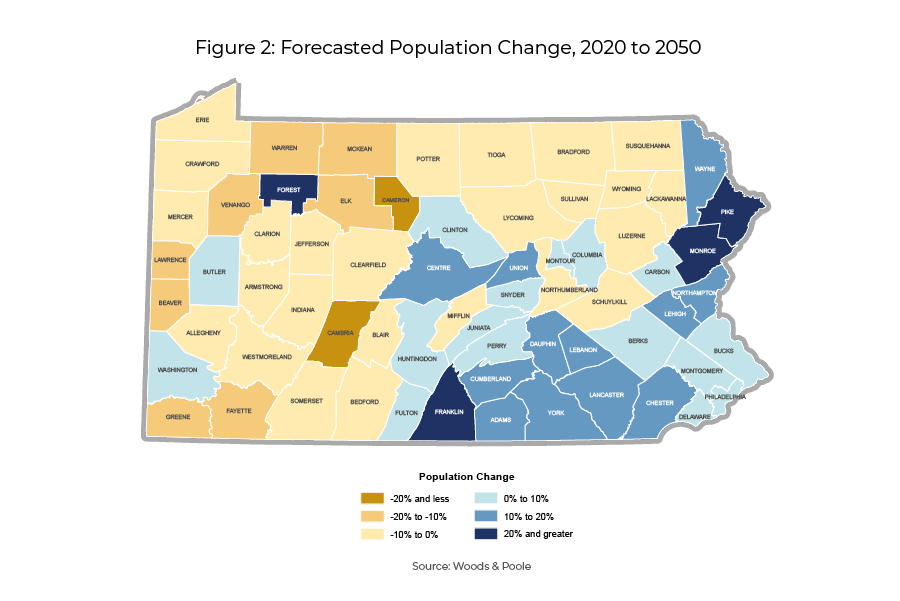
Figure 2 illustrates data from Woods & Poole in a map of Pennsylvania showing counties color-coded to depict the forecasted population change by percentage between 2020 and 2050.
Interstate Highway System
Trends & Issues
- Pennsylvania is served by 1,870 linear miles of Interstate highway—the fourth-largest network of Interstates in the nation (Figure 3).
- Interstates comprise only 6 percent of total state-owned roadway mileage yet accommodate 24 percent of all traffic volume. Moreover, these highways account for only 12 percent of total crashes (2019).
- Interstates registered 44 percent of all of Pennsylvania's work zone fatalities in 2019.
- Much of Pennsylvania's Interstate system was constructed more than 50 years ago and needs major rehabilitation or replacement.
- Further, much of the Interstate system will be over 80 years old at the end of the LRTP horizon year of 2045. Pavement reconstruction efforts are insufficient due to funding constraints, adding to the backlog of needs. Interstate funding in general has remained relatively flat since 2007 (Figure 4).
- Following federal asset management requirements, PennDOT has adjusted its programming philosophy to make greater levels of investment in the Interstate system. From a present-day level of approximately $450 million annually, funding is expected to grow to $1 billion by 2028. The level of Interstate funding has remained relatively constant since 2007 (Figure 4).
- While program planning for the Interstates was originally carried out regionally by MPOs and RPOs, PennDOT centralized planning functions for the Interstates in 2007 so they could be addressed as one strategic asset. PennDOT formed an Interstate Steering Committee (ISC) in 2015 to oversee the Interstate Management Program. The ISC includes representation from PennDOT's Center for Program Development and Management (CPDM), Bureau of Maintenance and Operations (BOMO), Bureau of Project Delivery (BPD), and the 11 PennDOT Engineering Districts.
- The ISC is currently documenting its decision-making processes as the means to review and potentially improve the procedures for project prioritization.
- MAP-21 and the FAST Act1 established Performance-Based Planning & Programming (PBPP) and Transportation Asset Management Plan (TAMP) requirements. These requirements are driving PennDOT to move toward Lowest Life- Cycle Cost asset management approaches, which prioritize timely repairs versus fixing the worst infrastructure first. PennDOT completed its current TAMP in June 2019.
Figure 3: Pennsylvania Interstate Highway System

Figure 3 is a state map from PASDA of Pennsylvania illustrating the 1,870 miles of interstate highway network miles and the Pennsylvania Turnpike.
Figure 4: Pennsylvania Interstate Funding History (Millions $)
.png)
Figure 4, a bar chart, illustrates Pennsylvania's interstate funding history from Federal and State sources from 2007 through 2020 from PennDOT's data.
1 Federal transportation legislation, respectively Moving Ahead for Progress in the 21st century and Fixing America's Surface Transportation Act.
Planning Implications
- The improvement needs of Pennsylvania's Interstate system are far greater than the funding available. Even with the projected ramp-up in funding to $1 billion annually by 2028, the state will continue to fall short of what is needed to keep the system in a state of good repair. It is estimated that $1.2 billion is needed per year to address cyclical asset management needs on the Interstate system. Increased funding will be needed for:
- The current backlog of assets needing improvement
- Modernization (fiber network, intelligent transportation system (ITS) expansion, operational improvements, safety and guiderail upgrades, all-weather pavement markings)
- Strategic Investments – selected capacity improvements, interchanges, truck climbing lanes
- The Secretary's Discretionary Funding on the Interstate system allows projects to advance that are vitally important to maintaining and improving Interstate infrastructure.
- P3 (Public-Private Partnership) project delivery is a tool that can augment resources for the Interstate program.
- PennDOT's Freight Investment Plan (FIP) is a multi-year, fiscally-constrained listing of projects to improve conditions on Interstates using funding from the National Highway Freight Program (NHFP). Pennsylvania currently receives over $61 million annually for the FIP, which is a key input to the TYP. FIP projects are focused on I-95 and several other interstates over the next decade.
- Interstate maintenance and related improvements are currently funded at only half the level necessary to keep with a desired preventive maintenance cycle. Further, by having to direct more funds to the Interstate program, resources are diverted from the rest of PennDOT's road and bridge network (Figures 5 and 6).
Figure 5: Forecasted Interstate Bridge Condition (by Deck Area)
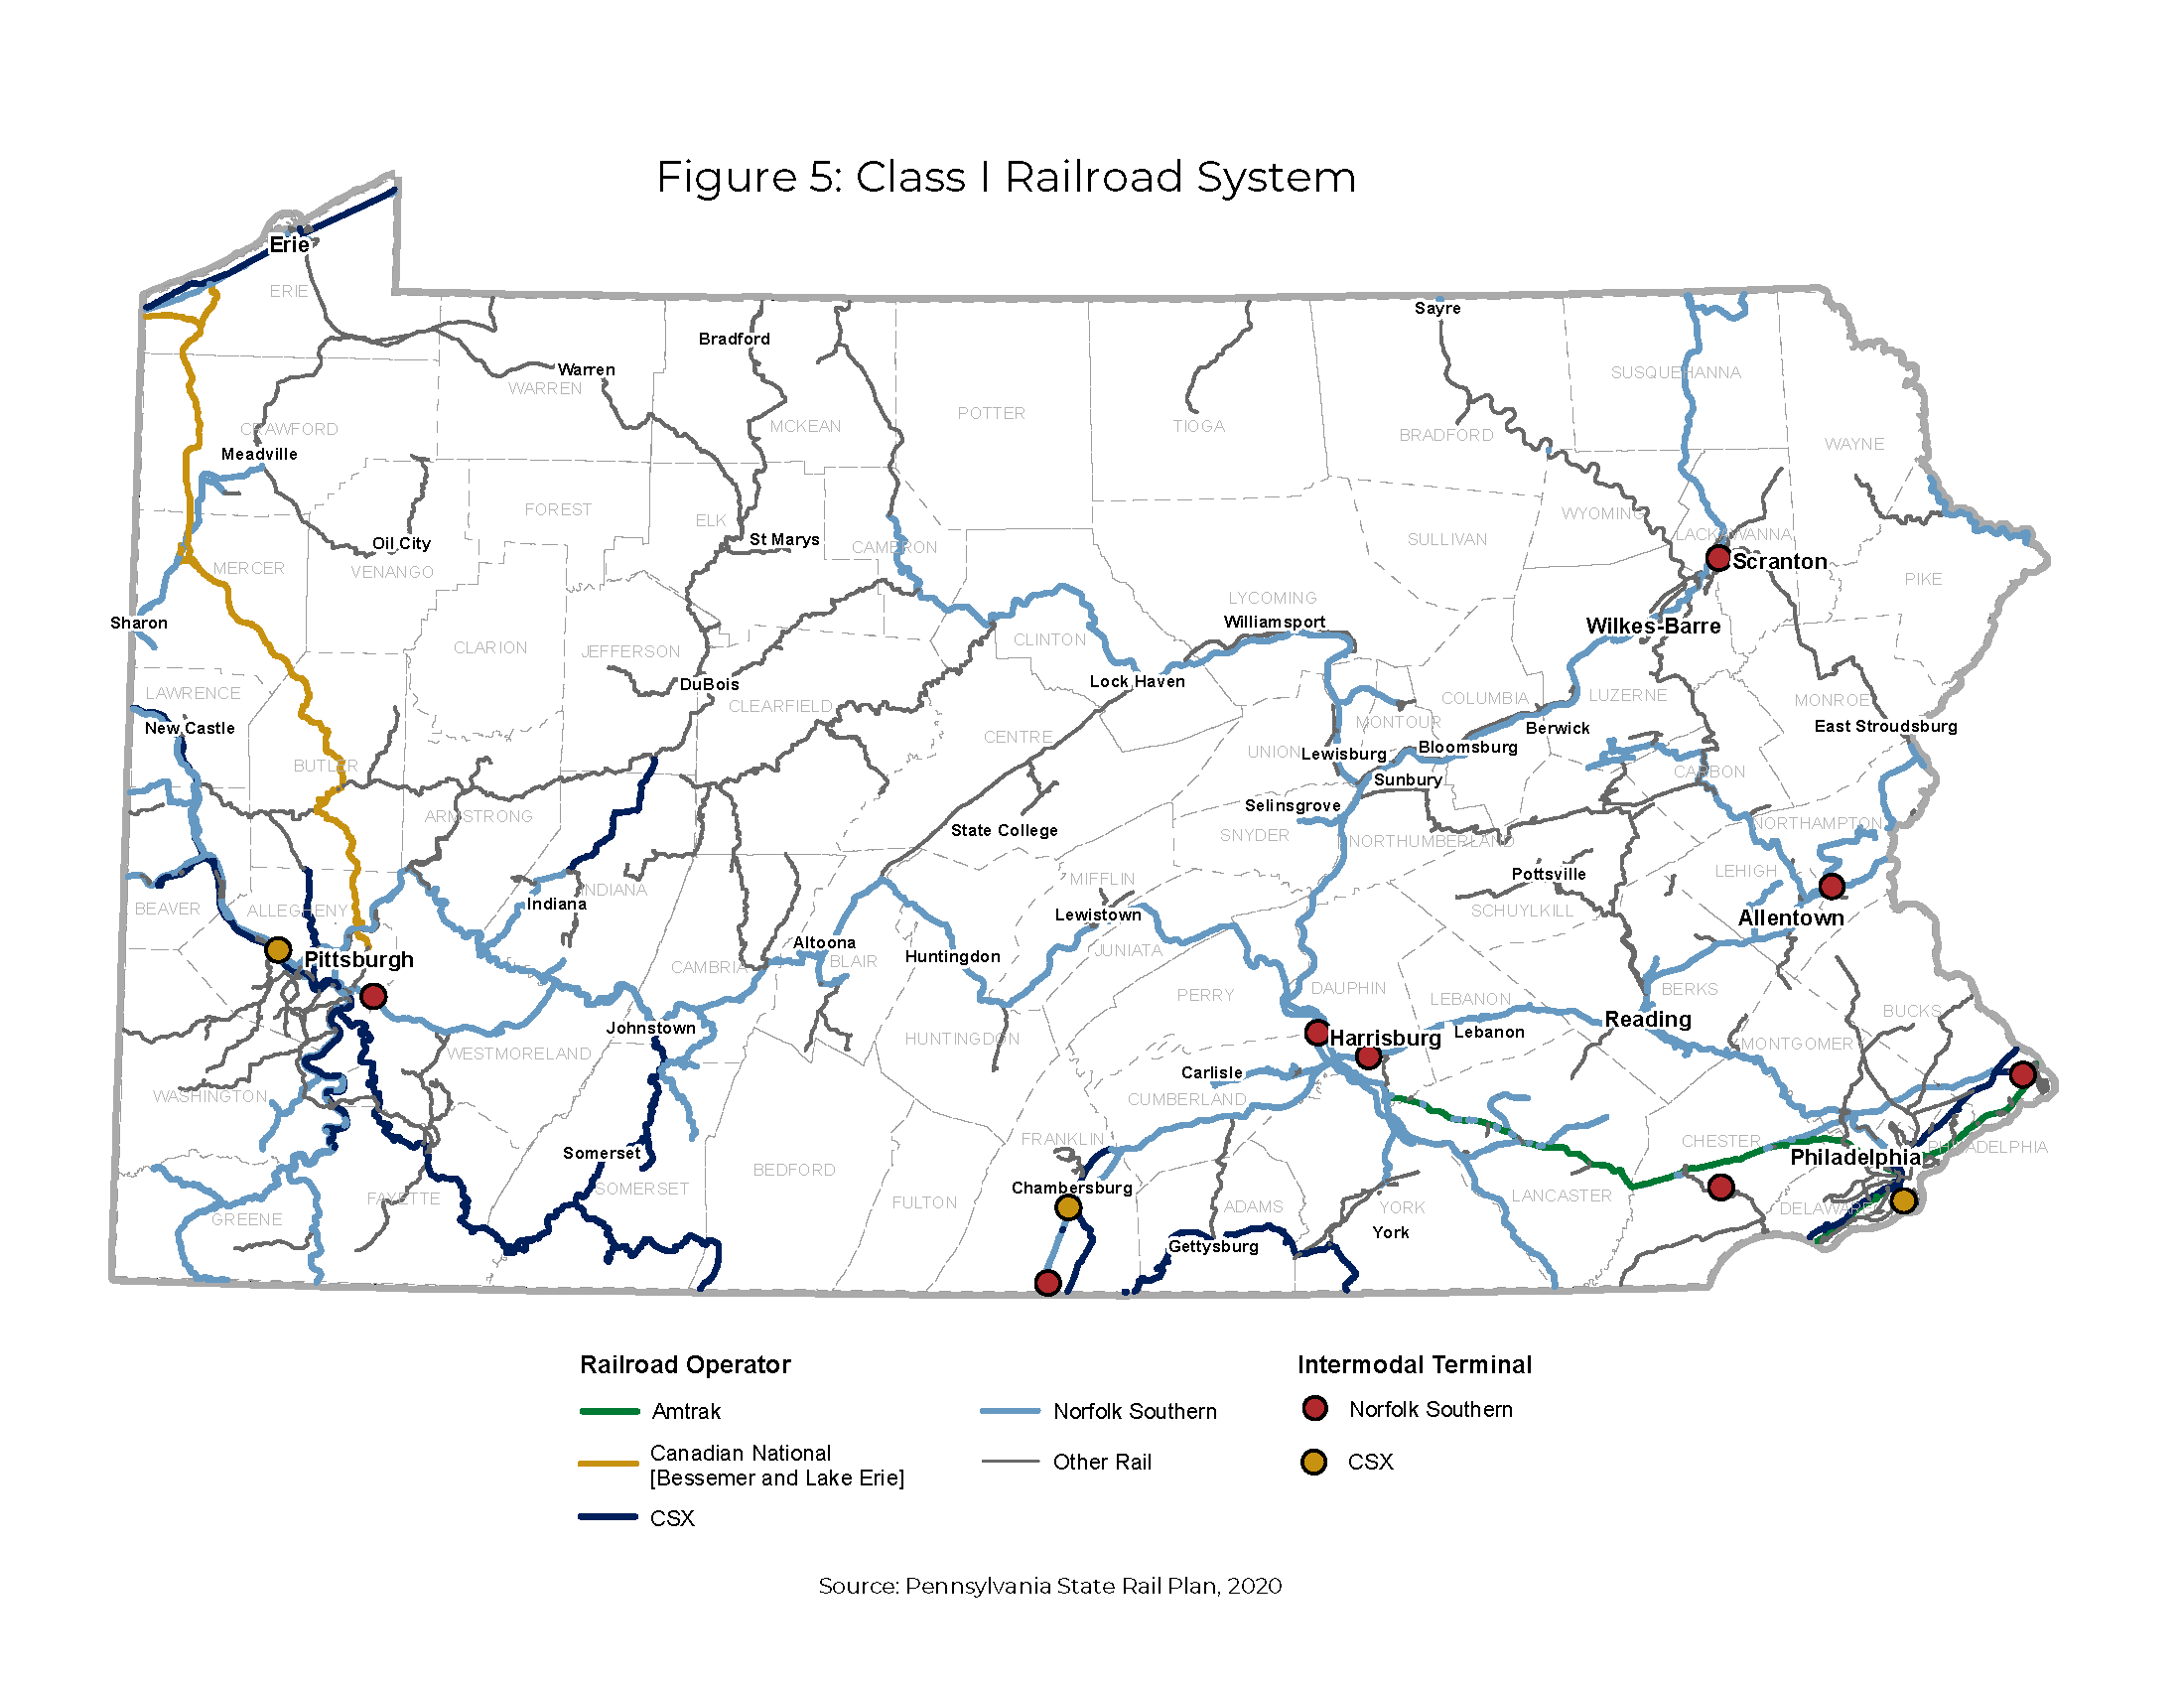
Figure 5, a bar chart, illustrates the forecasted bridge conditions by poor, fair, or good condition from 2019 through 2030 based on BAMS, EOY 2018 BMS2 data.
Figure 6: Forecasted Interstate Pavement Condition
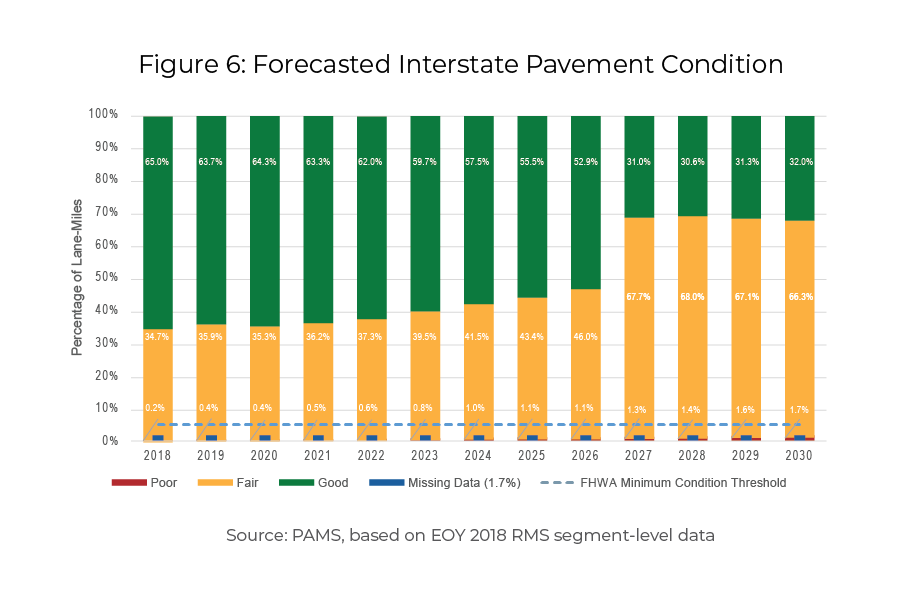
Figure 6, a bar chart, illustrates the forecasted interstate pavement condition by the percentage of lane-miles rated by poor, fair, and good. The chart also includes FHWA's Minimum Condition Threshold and a notation that 1.7% of data is missing. The data is from PAMS based on EOY 2018 RMS segment-level data.
Pennsylvania is served by 1,870 linear miles of Interstate – the Fourth-largest network of Interstates in the nation.
Non-Interstate Roadway Network
Trends & Issues
- Pennsylvania has a large and aging network of roadways. There are more than 120,000 linear miles of roadway in Pennsylvania—nearly 40,000 of which are owned, maintained, and operated by PennDOT; the rest of the extensive road network is primarily owned and maintained by local government.
- The extensive improvement needs for improving the local system of roads and bridges is also a major problem that was also discussed was addressed in the TROC funding proposal.
- Roadways are the backbone of Pennsylvania's transportation system, particularly in its more rural areas where National Highway System routes provide essential access (Figure 7).
- The state's roadway network accommodates approximately 281.5 million miles of travel, daily. Total demand for travel has remained relatively constant over the past decade.
- For planning and programming purposes, PennDOT has organized its highways into four Business Plan Network (BPN) classifications, including:
- National Highway System (NHS) Interstate (BPN 1)
- NHS Non-Interstate (BPN 2)
- Non-NHS with Average Daily Traffic (ADT) > 2,000 (BPN 3)
- Non-NHS with ADT < 2,000 (BPN 4)
- The Federal Highway Administration (FHWA) in February 2019 certified 423.79 miles of roadway as Critical Urban and Critical Rural Freight Corridors (CUFCs and CRFCs), making them eligible for National Multimodal Freight Network (NMFN) funding.
Figure 7: Pennsylvania NHS Routes
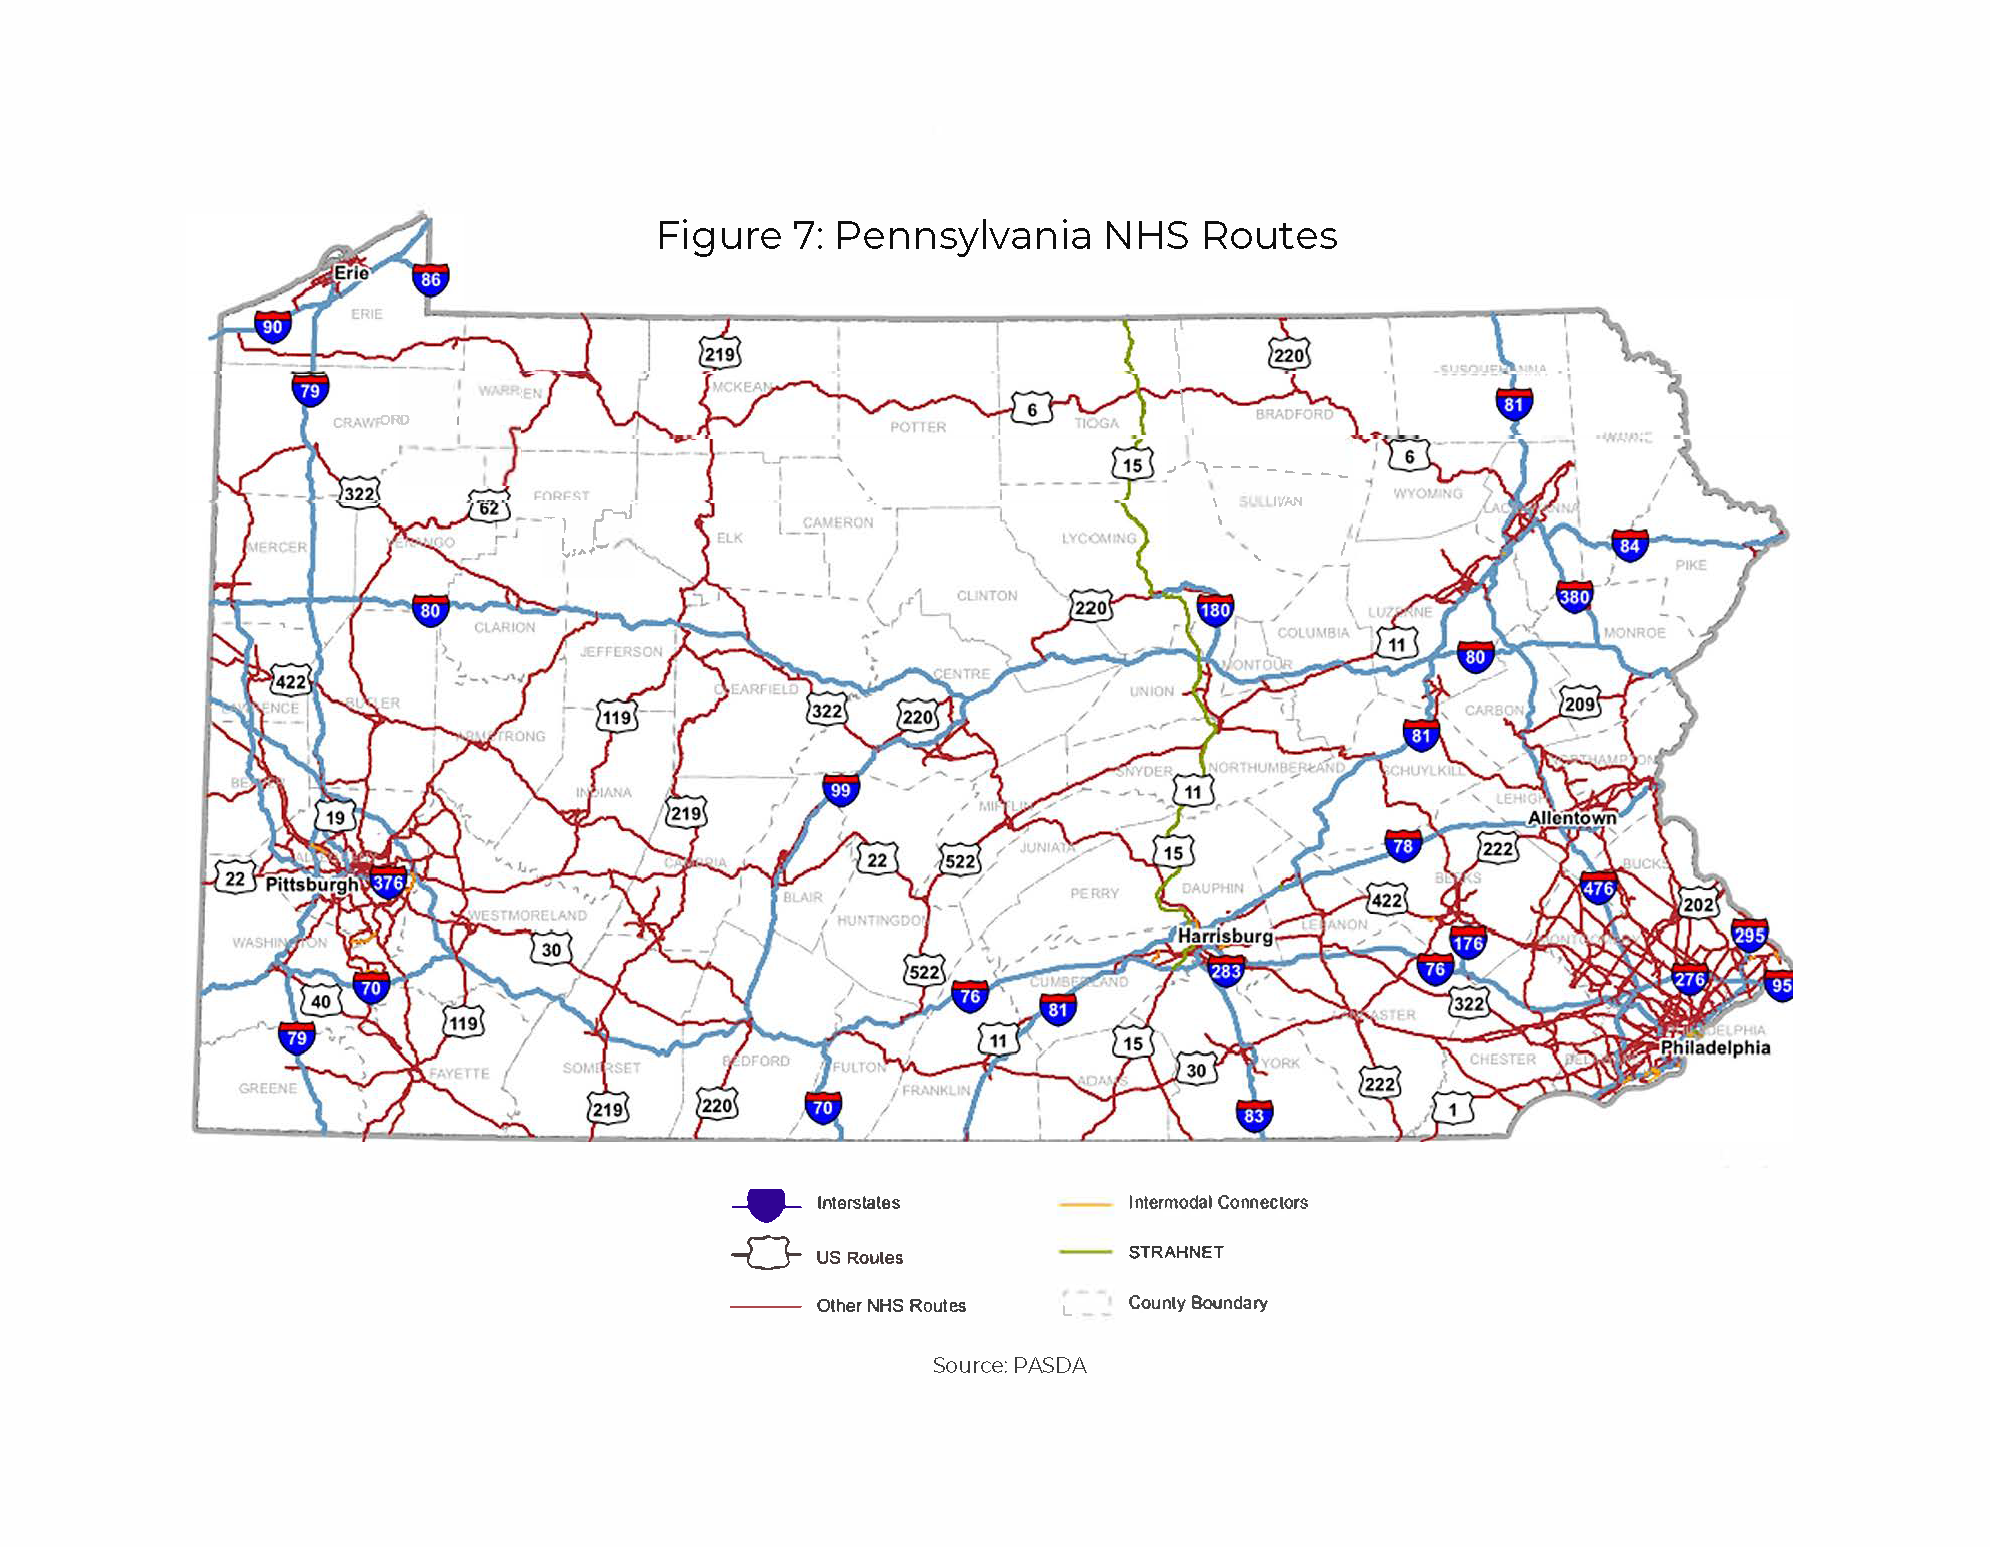
Figure 7 is a PASDA state map of Pennsylvania illustrating the National Highway System Routes, Interstates, US Routes, and county boundaries.
Planning Implications
- PennDOT is moving away from prioritizing roadway improvements from a “worst-first” approach in favor of a “lowest life-cycle cost” method. This approach is aimed at making timely improvements when needed to extend roadway life. Lowest life-cycle cost places greater emphasis on timely maintenance for system preservation. Lowest life-cycle cost as a strategic approach is especially important given the need to stretch limited resources.
- The extensive investment needed for system maintenance has resulted in fewer capacity-adding projects. Nonetheless, PennDOT is moving forward on several major roadway projects, including: the US 322 widening in Delaware County and the Central Susquehanna Valley Transportation (CSVT) project in Northumberland, Snyder, and Union counties.
- FHWA's November 2017 approval of Pennsylvania's first statewide freight plan pre-dated the certification of CUFCs and CRFCs. PennDOT will need to collaborate with the state's MPOs and RPOs on CUFC and CRFC designations as shipping patterns and demand changes. Use of PennDOT's forthcoming transportation planning data repository will be a useful resource as part of this initiative.
- Funding is inadequate to keep pace with rehabilitation and replacement projects needed to keep the system in optimal condition. Moreover, the increased age of Pennsylvania's roads and bridges minimizes the benefit of continual preservation treatments. As documented in the TROC Final Report, PennDOT's $8.8 billion annual budget must more than double—to approximately $18.15 billion—to adequately address transportation system needs.
- As population and industry continually shift in location and density across Pennsylvania, changes in land use patterns should be monitored to plan for potential shifts in highway and bridge needs.
- Continued coordination between county planning agencies and MPO/RPO officials will help to ensure that highway and bridge needs are clearly articulated in county comprehensive plans—fostering a needed transportation and land use connection.
- Local governments, through comprehensive plans, zoning, and subdivision and land development ordinances, can promote a mix of uses to encourage fewer private motor vehicle trips, reducing pressure on the existing highway and bridge network. Municipal adoption of access management ordinances can also ensure land use changes consider efficient transportation ingress/egress for new developments.
- With the continued rise in e-commerce, and freight activity in general, there is an increased need to store and deliver consumer goods. This has resulted in the expansion of warehouse and distribution facilities, particularly in the state's eastern and central regions. Communities should continue to plan in ways that take these transportation-intensive uses into account as early as possible rather than having to react, which also forces costly transportation improvements. Present resource constraint, if not addressed with additional funding, will make it increasingly difficult to “follow” such developments with the supporting transportation infrastructure.
- Due to the COVID-19 pandemic, county and local government leaders should begin to assess how community land uses might change, impacting the highway network. The pandemic accelerated trends such as e-commerce, the movement away from denser urban cores to single-family homes in suburban and rural areas, rising vehicle ownership, and increasing demand for bicycle and pedestrian infrastructure.
- The present funding shortfall poses a dilemma that must soon be resolved. As greatly limited resources are prioritized to the Interstate system to the greatest extent possible, other roads and bridges receive even less funding. This trade-off is untenable and unsustainable. A level of sufficient investment must be established to ensure that non-Interstate roads and bridges do not fall into an overall state of disrepair.
- With uncertainties over future funding levels and a substantial reduction in purchasing power, funding gaps continue to increase.
- To help address funding shortfalls, counties and local governments can continue to plan and zone for land use that leverages existing transportation assets and enables use of active transportation options. This will reduce the need for new highway and bridge infrastructure, helping to manage transportation costs.
- Further, local governments will likely need to make greater use of tools such as impact fees, transportation development districts, or developer agreements to help fund new highway and bridge construction.
- There are great challenges in using these tools, which are best suited to areas that are growing. For most areas of Pennsylvania that have stable or declining population growth and little non-residential development, the use of these tools is not practical.
- The present funding shortfall poses a dilemma that must soon be resolved. As greatly limited resources are prioritized to the Interstate system to the greatest extent possible, other roads and bridges receive even less funding. This trade-off is untenable and unsustainable. A level of sufficient investment must be established to ensure that non-Interstate roads and bridges do not fall into an overall state of disrepair (Figure 8).
There are 22 byways throughout the state. The Brandywine Valley Byway in Delaware County received national designation in 2021 and is now one of three national scenic byways in Pennsylvania. Despite the lack of federal funding for byways initiatives, PennDOT released an updated guidance manual in 2021 and has begun work on implementing an interagency action plan for promoting the byways program. The program is envisioned to expand beyond its historically highway-only-centric focus.
Figure 8: Forecasted NHS Pavement Condition
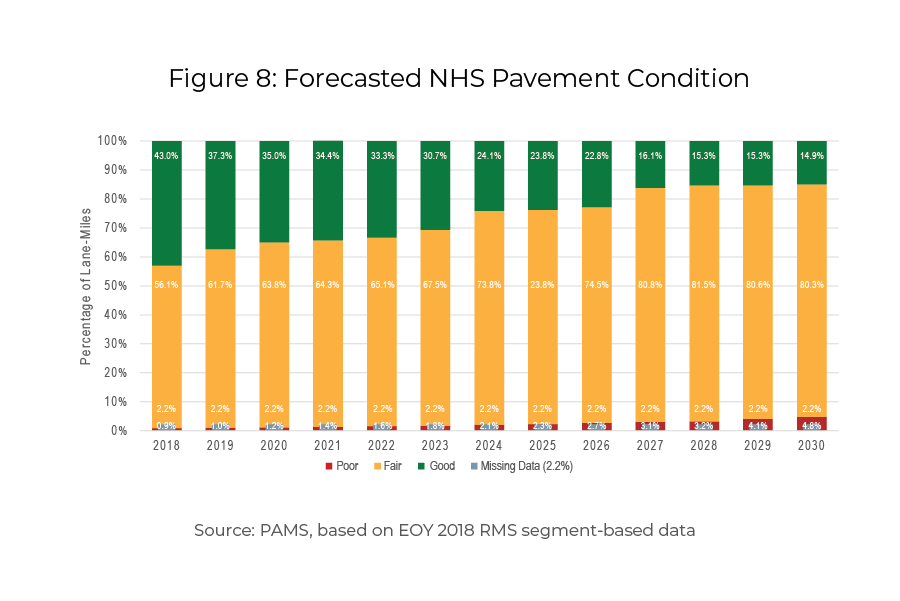
The Figure 8 Bar Chart illustrates the forecasted National Highway System condition by the percentage of lane-miles rated by poor, fair, and good. The chart also includes a notation that 2.2% of data is missing. Data for Figure 8 is from PAMS, based on EOY 2018 RMS segment-based data.
The move toward a “lowest life-cycle cost” methodology will extend the life of Pennsylvania's bridges and pavements but will also result in an increase in the total mileage of poor pavement. Even now, pavement conditions are transitioning from good to fair as roadways deteriorate faster than they can be repaired.
Bridges
Trends & Issues
- There are more than 25,400 bridges in Pennsylvania greater than 8 feet in length, representing nearly 117 million square feet in deck area.
- As of December 2021, the number of state-owned bridges rated "poor" was just under 2,500—less than half the number of poor bridges a decade earlier. This trend reflects a focused effort by PennDOT to reduce the backlog of bridges needing repairs by using both traditional funding sources and non-traditional means, such as Public-Private Partnerships (P3s).
- The condition on average of locally owned bridges over 20 feet long is also improving, but due to the sheer number and age of local bridges needing improvement, and extreme funding constraints, this continues to be a major challenge for communities.
- Pennsylvania has made significant progress in bridge construction to reduce the number of weight-restricted bridges. Initiatives such as the Rapid Bridge Replacement Project, which replaced 558 bridges through P3s, have successfully reduced the number of these bridges.
- The percentage of poor bridges steadily increases across all lower-order business plan networks, because the structures are deteriorating faster than they can be repaired or reconstructed under current funding constraints. Given the age of Pennsylvania's bridges, barring a funding breakthrough this trend is forecasted to continue through 2030 (Figure 9).
- As mentioned in the previous section, PennDOT has organized its roadways and bridges into four Business Plan Network (BPN) classifications, including: NHS Interstate; NHS Non-Interstate; Non-NHS with ADT > 2,000; and Non-NHS with ADT < 2,000. All BPNs have less than 10 percent of bridge deck area rated poor, and bridges on non-NHS routes have larger share of deck area than NHS routes that is considered in good condition than NHS routes. More than 75 percent of Interstate deck area is fair; only 19 percent is considered good (Figure 10).
There are over 25,400 bridges in Pennsylvania greater than 8 feet in length, or nearly 117 million square feet of deck area. The average state-owned bridge is 55 years old.
Planning Implications
- The number of bridges rated poor has decreased significantly in recent years. However, there is inadequate funding to continue the “worst-first” method of prioritization. Transitioning to a "lowest life-cycle cost” approach, based project selection will help keep good bridges from becoming poor and yield additional years of service from existing poor structures, but does not address the funding need gap directly.
- The financial burden for maintaining legacy structures constructed decades ago is extensive for municipalities that are not growing, particularly rural municipalities.
- The highest proportion of state bridges were built during the peak interstate construction period from the late 1950s through the early 1970s, but there are many older bridges still in use. A large number of bridges have also been built in more recent years (Figure 11).
Figure 9: Forecasted Poor Bridges by Business Plan Network (by Deck Area)
.png)
Figure 9, a bar chart, illustrates the percentage of forecasted poor bridges by Business Plan Network from 2019 through 2030 from PAMS, based on EOY 2018 BMS 2 data.
Figure 10: Bridge Condition by Business Plan Network
| BPN | Description | Total Count | Total Deck Area (SF) | % Good by Deck Area | % Fair by Deck Area | % Poor by Deck Area |
| 1 | NHS Interstate | 2,205 | 29,930,489 | 19% | 75% | 6% |
| 2 | NHS Non-Interstate | 4,952 | 44,243,042 | 29% | 66% | 5% |
| 3 | Non-NHS with Average Daily Traffic (ADT) ≥ 2,000 | 6,847 | 23,323,118 | 35% | 59% | 7% |
| 4 | Non-NHS with ADT < 2,000 | 11,411 | 18,402,349 | 39% | 51% | 10% |
| Source: Bridge ≥8' Data: BMS2 as of 6/30/2020 |
Figure 11: Bridges Built by Decade
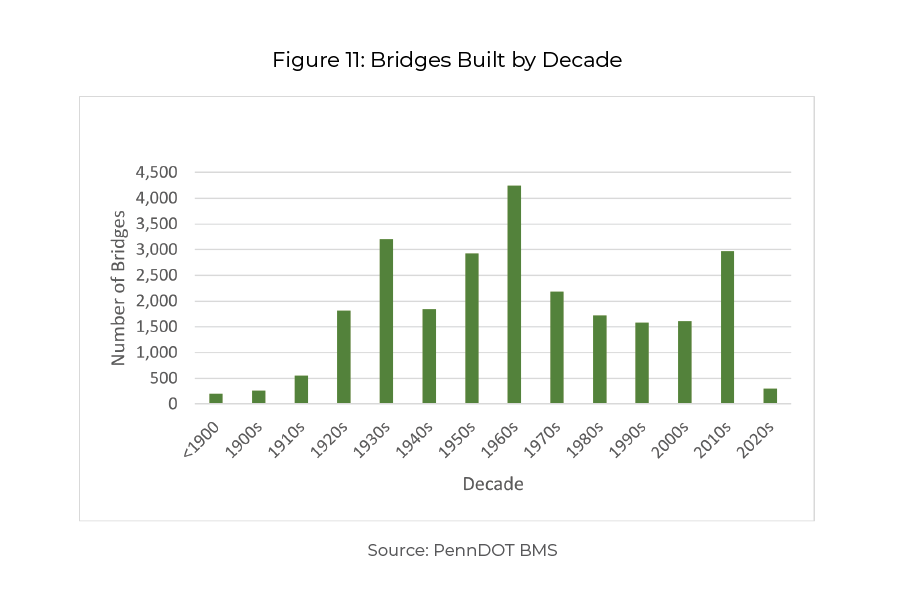
Figure 11, a bar chart, depicts the number of bridges built by decade from 1900 through 2020 from PennDOT BMS data.
As the state's bridge inventory continues to age, PennDOT will be faced with a greater stock of bridges that will require increased maintenance and rehabilitation. Maintenance needs will accelerate as the bridges that were built during the 1950s and 1960s deteriorate to the point where rehabilitation or replacement is required.
PennDOT entered into agreement with some municipalities to manage local bridge bundle packages, with PennDOT handling consultant selection, design, construction, and inspection. This has helped improve local bridge conditions.
Additionally, the State Transportation Commission approved a Local Small Bridges Study report in 2021. The study included recommendations to help create increased capacity and incentives to facilitate uniformity in local small bridge (i.e., less than 20 feet in length) asset management.
Traffic Operations
Trends & Issues
- Improving transportation operations can be a cost-effective way to improve capacity and improve traffic flow. As Pennsylvania continues to operate within an increasingly constrained funding environment, there will be the need to emphasize improving operations (handling more trips on the existing system) over capacity-building (such as adding lanes and building new roads).
- PennDOT has developed a TSMO Program (Transportation Systems Management and Operations) (TSMO) Program that is currently being implemented. The program is designed to “advance projects and services designed to get the safest and most efficient use out of the existing and planned roadway network” (FHWA, Planning for Operations Program) and is currently implementing it. PennDOT maintains four TSMO regions (Figure 12).
- There are more than 13,800 traffic signals in Pennsylvania, which are primarily owned, maintained, and operated by more than 1,200 municipalities. Signal equipment that is properly timed and maintained helps improve travel efficiency and reduces the cost of signal operation/maintenance over time.
- Signals are permitted by PennDOT and owned by local jurisdictions; therefore, there is a disconnect between funding realities and the desire to maintain and upgrade signal systems to keep pace with new technology. Rapid changes in technology could bear positively on addressing this disconnect in the future.
- There were 18,959 traffic incidents on Pennsylvania roadways in 2019, with an average incident clearance time of 95 minutes. Both the number of incidents and the average clearance time have increased in recent years.
- PennDOT has been updating Regional Operations Plans (ROPs) for each TSMO region that identify Intelligent Transportation Systems (ITS) and operations infrastructure needs, visions, and goals. Additionally, the Commonwealth is working to establish a statewide fiber optic network that will accommodate improved ITS solutions for traffic operations.
Planning Implications
- The gains that PennDOT has achieved in recent years related to signals and ITS investments could slow or reverse based on the current funding environment. Challenging state and local funding scenarios will likely limit the ability of municipalities and PennDOT to maintain and upgrade their traffic signals and ITS devices.
- Pennsylvania can expect more commercial vehicles on the road and an increased number of trucking distribution centers. This growth will require additional accommodations such as parking areas, queueing zones, and longer traffic signal phases to account for the slower acceleration and deceleration of heavy trucks.
- Emerging technologies may significantly alter how the state's transportation system operates and is designed over the next 20 years. Some examples of emerging technology include integrated corridor management, connected ITS infrastructure, connected vehicle “platoons,” and highly autonomous and/or connected public transit and private automobiles.
- As population and industry shift in location and density across Pennsylvania, changes in land use patterns should be monitored to plan for potential shifts in transportation demand.
- With uncertainties in revenue and a decline in buying power, funding gaps for TSMO continue to widen. TSMO strategies (and planning for operations in design and construction decision-making) can help funding stretch further compared to investments in traditional capital infrastructure investments.
Figure 12: Pennsylvania's TSMO Regions
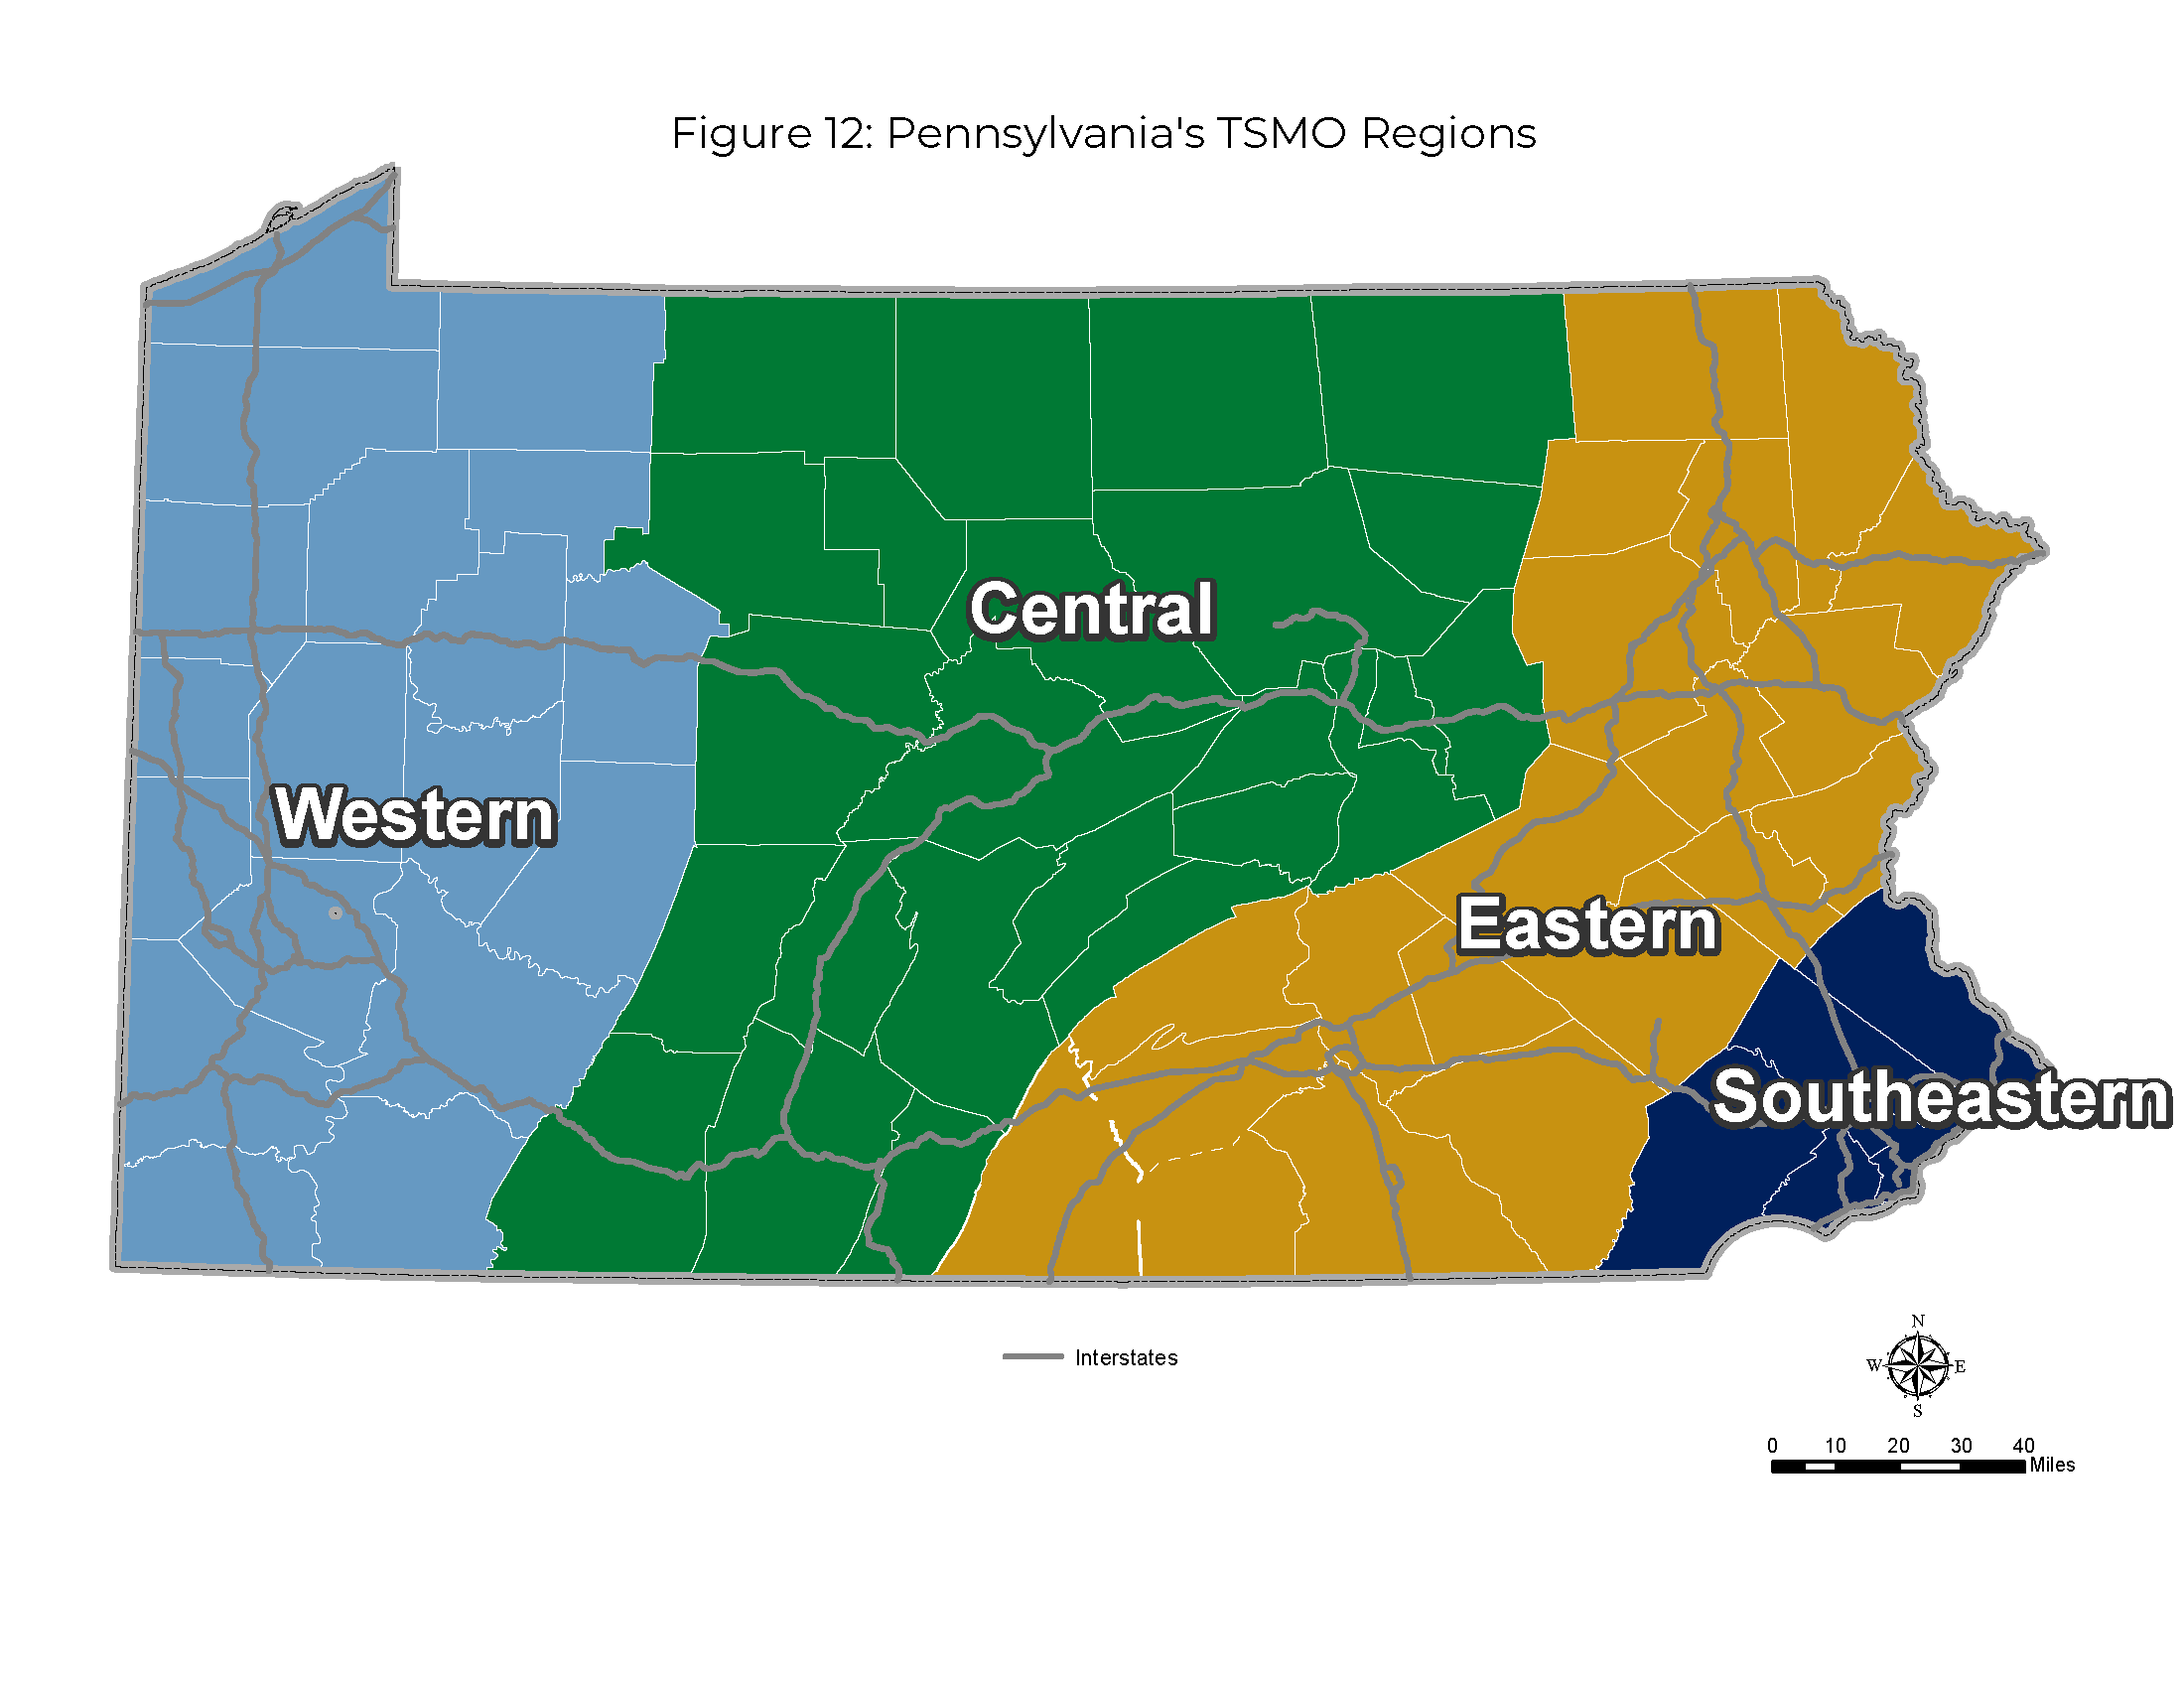
Figure 12 is PennDOT's state map of Pennsylvania illustrating the four Transportation Systems Management and Operation regions of Western, Central, Eastern, and Southeastern.
Broadband is now the modern-day form of transportation
Planning Implications (cont'd)
- There are many uses for fiber optic lines that go beyond connected and automated vehicles, e.g., access to work, school, and telemedicine for rural hospitals. The introduction of fiber can bring immediate benefits even as the technology matures and develops. Indeed, transportation and communication continue to merge in many new ways.
- An area that will be important to understand as it relates to technological advances includes curb side management. As the economy moves toward more e-commerce, the use of parking lanes and public right-of-way adjacent to businesses may change in very dynamic ways from what we are accustomed to current patterns.
- Freight movement will be heavily influenced by improvements in traffic operations and technology, as advancements will improve operating efficiencies and address operator hours hours-of-service requirements. In the future, some freight may be moved by automated vehicles for long-haul driving, with human drivers for the “first- and last-mile.” It will be easiest to accommodate automation on the Interstate system, with its highly standardized and well-maintained pavement markings and signage and more unified ownership and oversight.
There are over 13,800 Traffic Signals in Pennsylvania, which are primarily owned, maintained, and operated by over 1,200 municipalities. Enhanced traffic signal performance helps improve travel efficiency and highway safety.
Public Transportation
Trends & Issues
- All 67 Pennsylvania counties are served by at least one mode of public transportation, provided by 57 transit agencies (Figure 13).
- Four distinct types of services are available to transit users: fixed-route bus, shared-ride demand-response bus, intercity bus, and passenger rail. Each mode has unique operating characteristics, customer needs, and funding sources.
- Act 44 of 2007 required the Pennsylvania Turnpike Commission to make annual payments of $450 million to the Pennsylvania Public Transportation Trust Fund. Those payments will be reduced to just $50 million annually, beginning in 2022, posing a serious challenge for public transportation. It is important to note that this payment reduction would be replaced by proceeds from a Motor Vehicle Sales Tax when the annual payments end. Maintaining public transportation funding levels is vital.
- Public transportation usage across the nation has decreased in each of the last four years, even before the COVID-19 pandemic. While overall ridership in Pennsylvania has followed that trend, 15 transit agencies in Pennsylvania have experienced ridership growth. The decline in transit use could reverse in the future due to numerous factors including federal policy and changing demographics.
- PennDOT's Intercity Bus Program subsidizes a variety of services through several carriers, providing opportunities to travel into and outside of the state providing intrastate and interstate travel options (Figure 14).
- Pennsylvania's transit agencies have an annual economic impact of approximately $3.8 billion. This direct, indirect, and induced activity supports more than 32,000 jobs with $2.1 billion in employee compensation. Operating activity also generates $76 million in annual tax revenue for the Commonwealth.
- A significant portion of transit funding in Pennsylvania is provided through state-level programs and subsidies. In addition to programs like the senior shared-ride program and the Persons with Disabilities mobility program, Pennsylvania Acts 44 and 89 provide significant revenue streams for fixed-route operations and capital projects, respectively. By contrast, in other states the majority of funding for transit systems comes from local funds or federal funds. Pennsylvania's support for public transportation has been substantial.
- Act 44 of 2007 identified four performance criteria in an effort to measure the efficiency and effectiveness of transit agencies: Passengers per Revenue Vehicle-Hour (RVH), Operating Cost per RVH, Operating Revenue per RVH, and Operating Cost per Passenger. The following statewide trends have been observed, and it must first be noted that about a quarter of FY 2019-20 transit ridership was dramatically reduced by the pandemic, including the state-mandated shutdown of service. The following statistics provide the resulting statewide trends:
- Total Act 44 passenger trips decreased 22.4 percent between FY 2018-19 and FY 2019-20.
- Revenue vehicle-miles decreased 9.5 percent between FY 2018-19 and FY 2019-20.
- Overall, vehicle revenue-hours decreased 8.3 percent between FY 2018-19 and FY 2019-20.
- Figures 15 and 16 provide more detail on historic ridership trends for fixed-route and shared-ride demand-response programs
Figure 13: Transit Systems
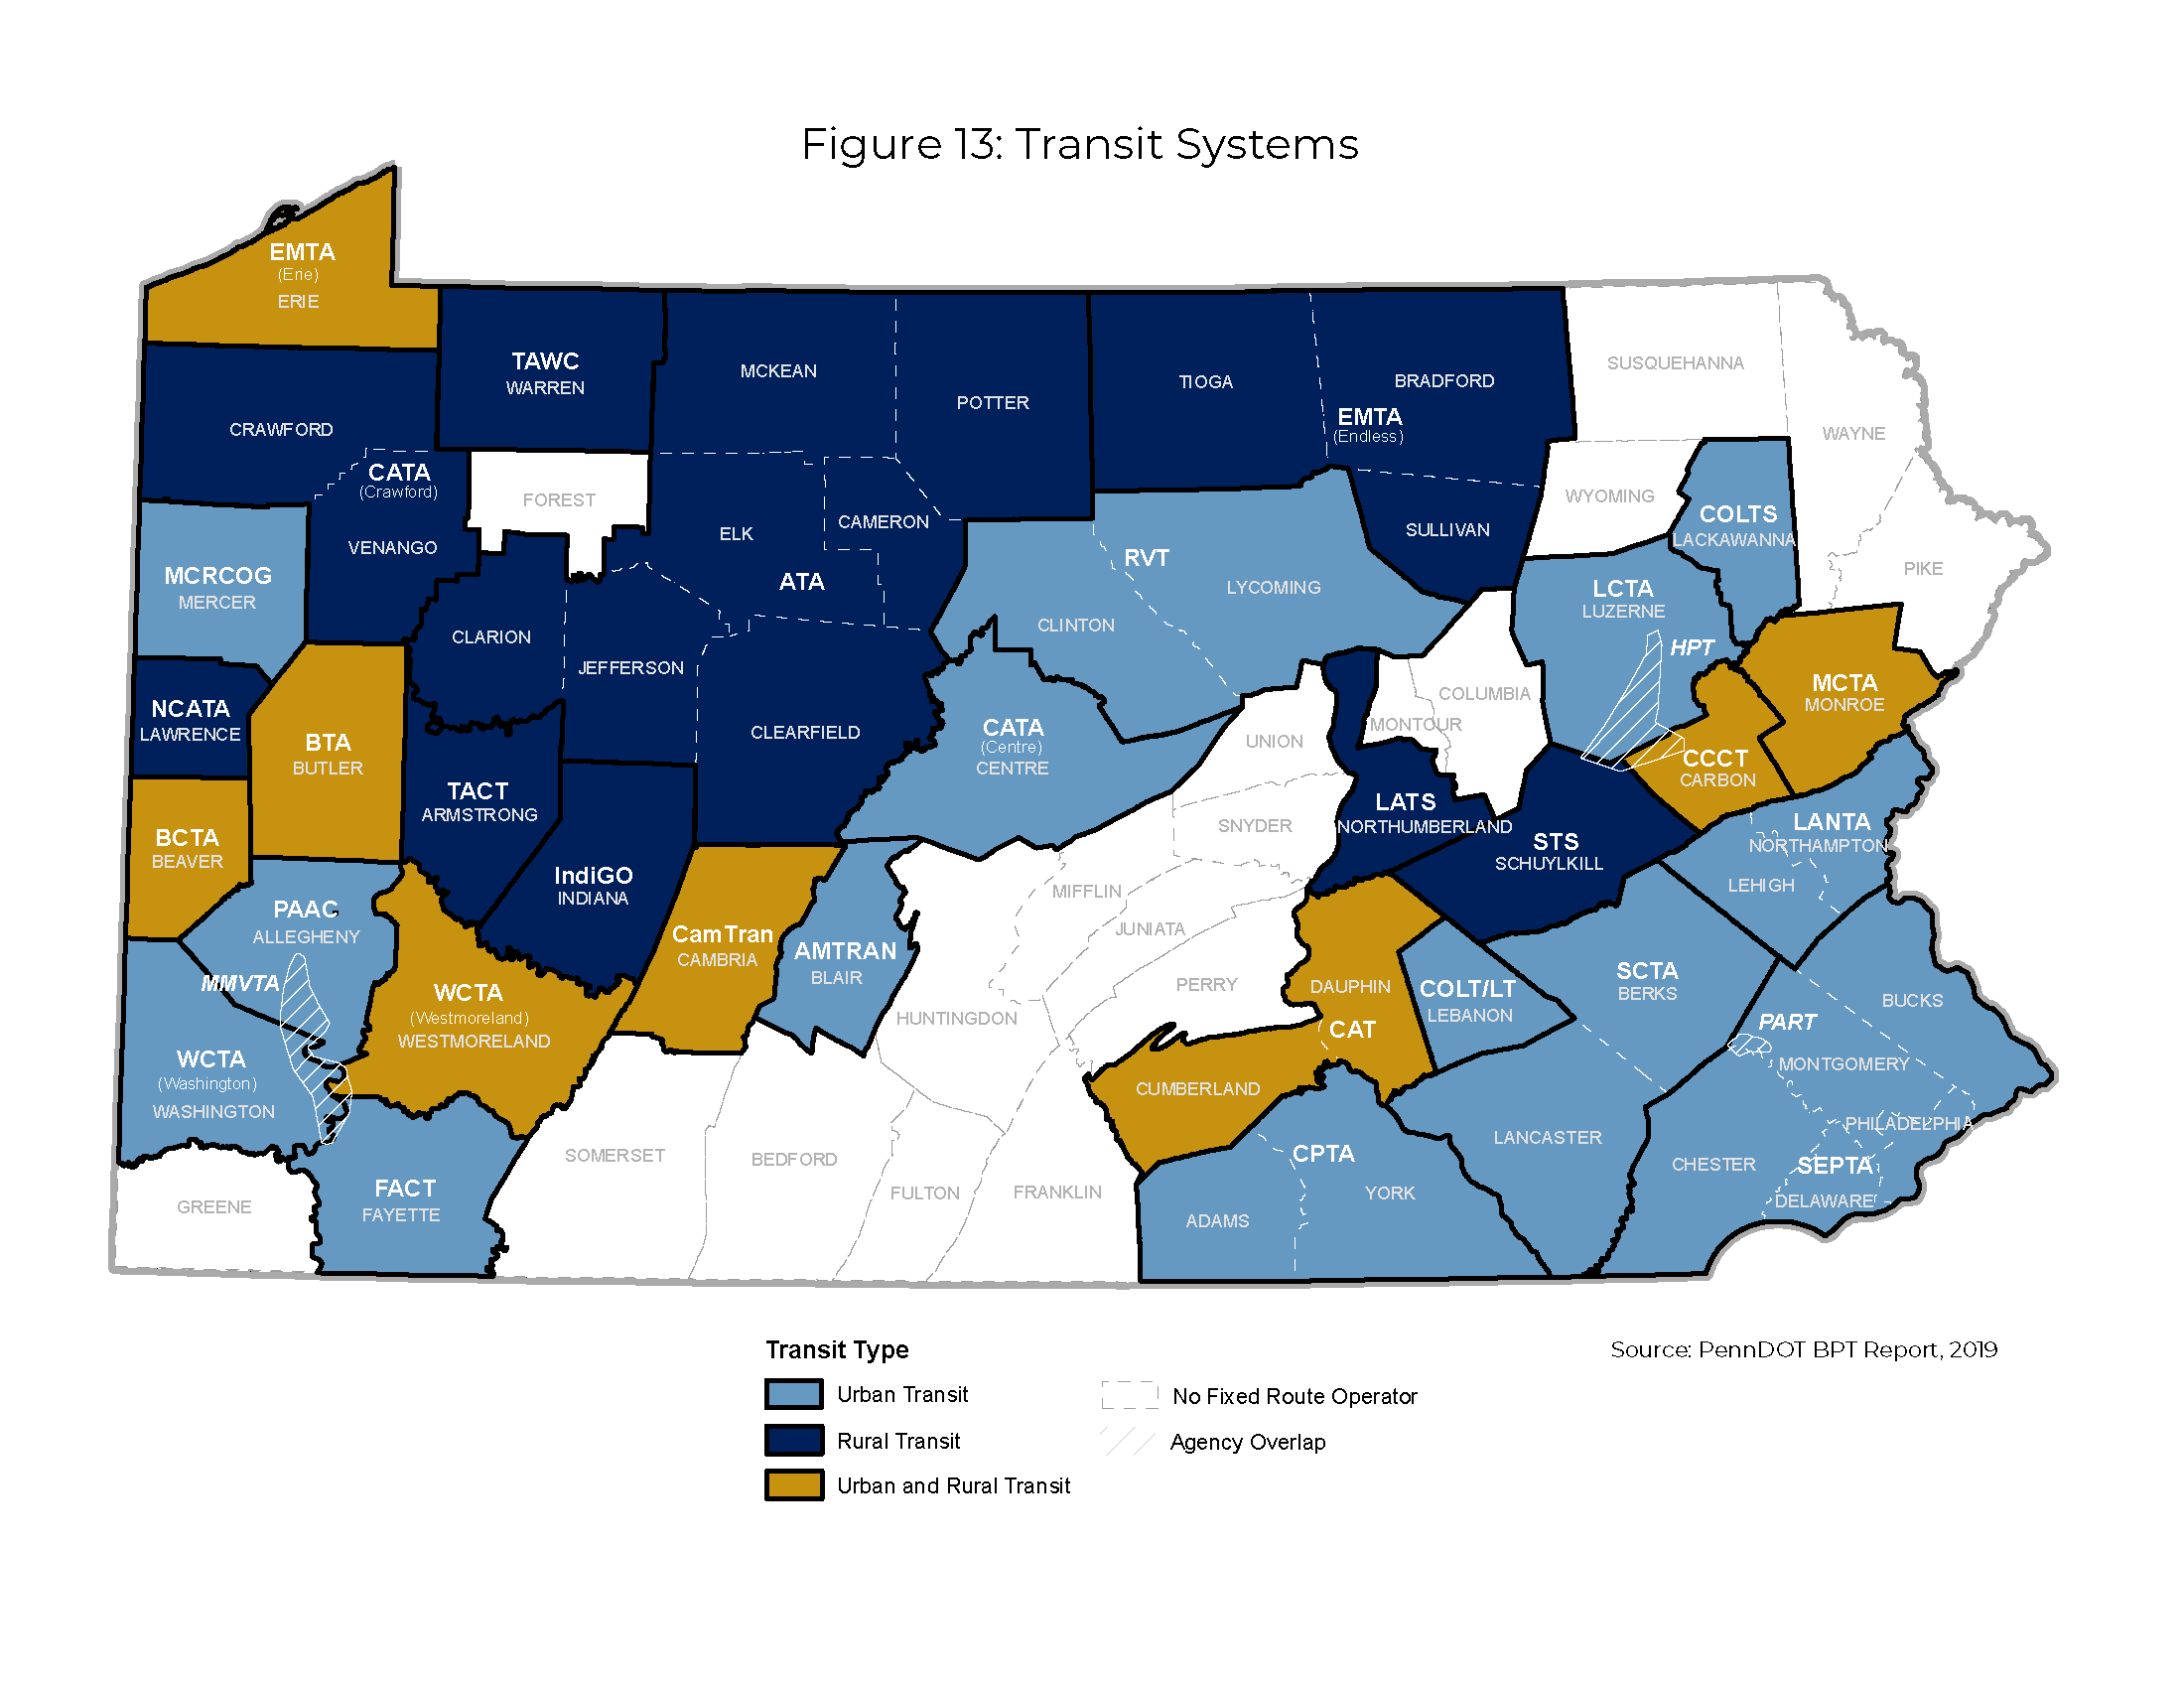
Figure 13 is PennDOT's 2019 BPT Report map of Pennsylvania depicting Pennsylvania Transit systems by Urban Transit, Rural Transit, No Fixed Route Operator and Agency Overlap by county.
Planning Implications
- The effects of the pandemic continue to significantly reduce transit ridership and increase operating costs.
- With the exception of COVID-19 federal relief funding, Federal funding for public transportation has basically been flat over the past five years as MAP-21 funding transitioned to the FAST Act funding program.
- State funding for public transportation is essential and will need to increase to help support the state's mobility needs. The July 2021 TROC proposal offers strategies to address the public transportation funding problem.
- Other planning implications for public transportation:
- Shared -ride services may be particularly difficult to sustain coming out of the pandemic, and especially so given other trends such as seniors driving longer, etc.
- Preparing for climate change initiatives is likely going to be an area that receives a great amount of attention in the near term to prepare for long-term change.
- Alternative energy sources for public transit fleet including compressed natural gas (CNG), and battery electric presents an opportunity to further promote transit while making the investments in fleet updates.
Figure 14: Intercity Bus Transportation (Subsidized Routes)
.png)
Figure 14 is PennDOT's Bureau of Public Transportation map of Pennsylvania illustrating the intercity transit routes from Erie, Pittsburgh, Harrisburg, Allentown, and Philadelphia.
Figure 15: Fixed-Route Ridership
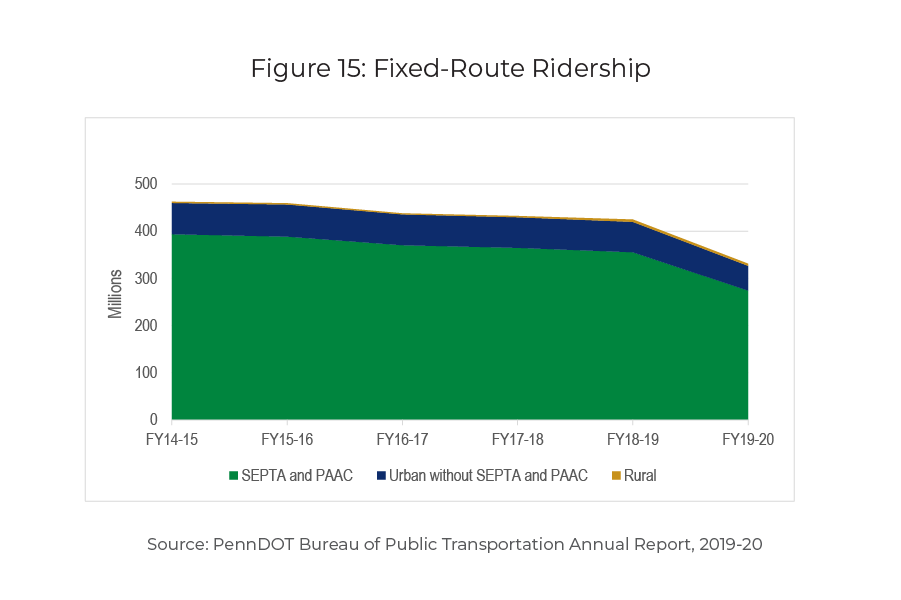
Figure 15 is a graph illustrating the millions of fixed-route ridership for SEPTA and PAAC, Urban without SEPTA and PAAC, and Rural for Fiscal Year 2014 - 2015 through Fiscal Year 2019 - 2020 from PennDOT's Bureau of Public Transportation Annual Report, 2019-20.
With over 300 million trips taken in Fiscal Year (FY) 2019-20, fixed-route urban transit represents the majority of the passenger trips provided in Pennsylvania each year (Figure 15). The overwhelming majority (91 percent) of these trips are provided by the two largest transit agencies, the Southeastern Pennsylvania Transit Authority (SEPTA) serving the Philadelphia region, and Port Authority of Allegheny County (PAAC) in Pittsburgh.
Figure 16: Shared-Ride Trips
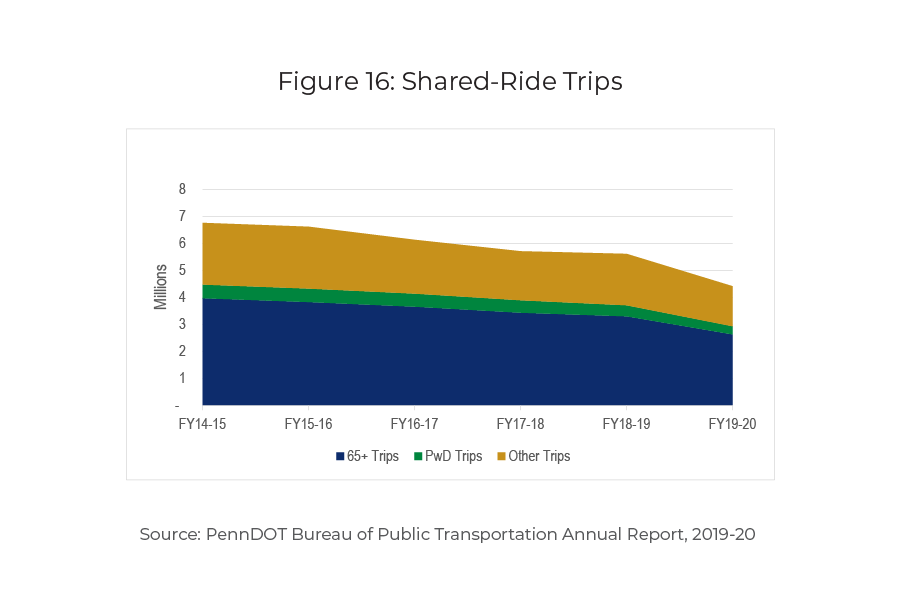
Figure 16 is a graph illustrating the millions of shared-ride trips by riders 65+, Persons with Disabilities and other trips from Fiscal Year 2014 - 2015 through Fiscal Year 2019 - 2020 from PennDOT's Bureau of Public Transportation Annual Report, 2019-20.
Pennsylvania has one of the most comprehensive coordinated shared-ride demand-response programs in the nation. During the four-year period ending FY 2018-19, coordinated shared-ride trips declined by nearly 1.1 million (Figure 16). This loss can be primarily attributed to seniors continuing to drive into older age than in the past.
Figure 17: Community Transportation Systems
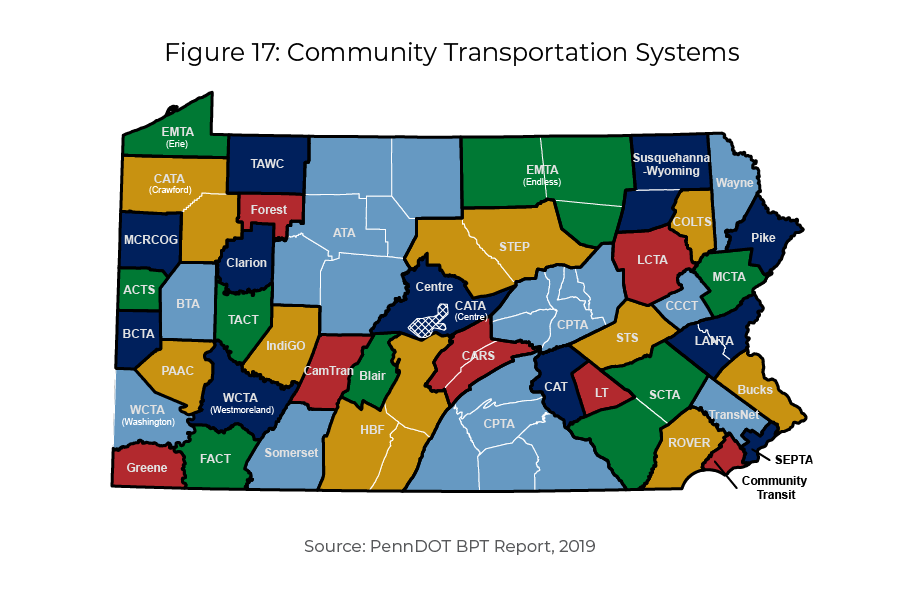
Figure 17 is a Pennsylvania state county map depicting the community transportation systems that serve each county from the 2019 PennDOT BPT Report.
With over 300 million trips taken in FY19-20, fixed-route urban transit represents the majority of the passenger trips provided in Pennsylvania each year, and most of these trips (91%) are provided by the Southeastern Pennsylvania Transit Authority (SEPTA), and Port Authority of Allegheny County (PAAC).
Passenger Rail
Trends & Issues
- Intercity passenger rail service in Pennsylvania is primarily provided by the National Railroad Passenger Corporation, known as Amtrak. Amtrak operates 13 service lines on five corridors in Pennsylvania that range from high-speed service along the Amtrak-owned Northeast Corridor (NEC) to daily long-distance service along the Capitol Limited route through the southwestern corner of the state (Figure 18). There have been extensive efforts to increase passenger rail service between Harrisburg and Pittsburgh.
- Total boardings and alightings (exits at the destination) for Amtrak's 24 Pennsylvania stations for Federal Fiscal Year (FFY) 2019 were 6.67 million (Figure 19). Ridership originating in Pennsylvania has increased by more than 700,000 trips over the past five years. These trends are expected to continue across all Pennsylvania Amtrak stations as ridership is projected to grow by 1.4 million (21 percent), climbing from 6.7 million in FFY 2019 to 8.1 million in FFY 2025.
- Additionally, the Southeastern Pennsylvania Transportation Authority (SEPTA) Regional Rail system, and NJ Transit's Atlantic City Line provide regional commuter rail services among communities in the Philadelphia metropolitan region and between Atlantic City and Philadelphia, respectively.
- The SEPTA Regional Rail system offers commuter rail service in the five-county Philadelphia region (in addition to Trenton, NJ; West Trenton, NJ; Newark, DE; and Wilmington, DE), operating 13 service lines across 280 route-miles. In FY 2019, SEPTA reported an annual Regional Rail ridership of 34,190,970 (a decrease of 0.5 percent from FY 2018) and average weekday regional rail ridership of 119,000. Port Authority of Allegheny County (PAAC) also provides light rail services to areas surrounding the City of Pittsburgh within Allegheny County.
- According to ridership projections prepared by the Delaware Valley Regional Planning Commission (DVRPC), the SEPTA Regional Rail network is projected to grow by 8,730 person-trips (7.3 percent) and by 9,176 passenger-miles (5.2 percent) from 2020 to 2045. Funding for improvements to accommodate the projected growth will be critically important for users, traffic congestion, and environmental reasons.
- Both Amtrak's and SEPTA's major stations facilitate intermodal connections with local bus and light rail transit options. Amtrak has operating agreements with commuter (SEPTA and NJ Transit) and freight (CSX and Norfolk Southern) rail operators throughout Pennsylvania for shared use of rail infrastructure.
- Ridership demand declined by nearly 30 percent during FY 2019-20 due to the COVID-19 pandemic. Amtrak's Keystone Service between Harrisburg and New York via Philadelphia was suspended for several weeks as a pandemic public safety measure. Ridership on SEPTA's Regional Rail decreased dramatically due to the pandemic. As of August 2021, Regional Rail ridership was approximately 20 percent less of where it was, pre-pandemic.
More than 4.5 million Amtrak passengers used Philadelphia's 30th Street Station in FFY 2019, making it thethird-busiest Amtrak station in the countryafter Penn Station in New York City and Union Station in Washington, D.C. Stations in Lancaster and Harrisburg each served more than 500,000 passengers.
Figure 18: Amtrak Service Lines
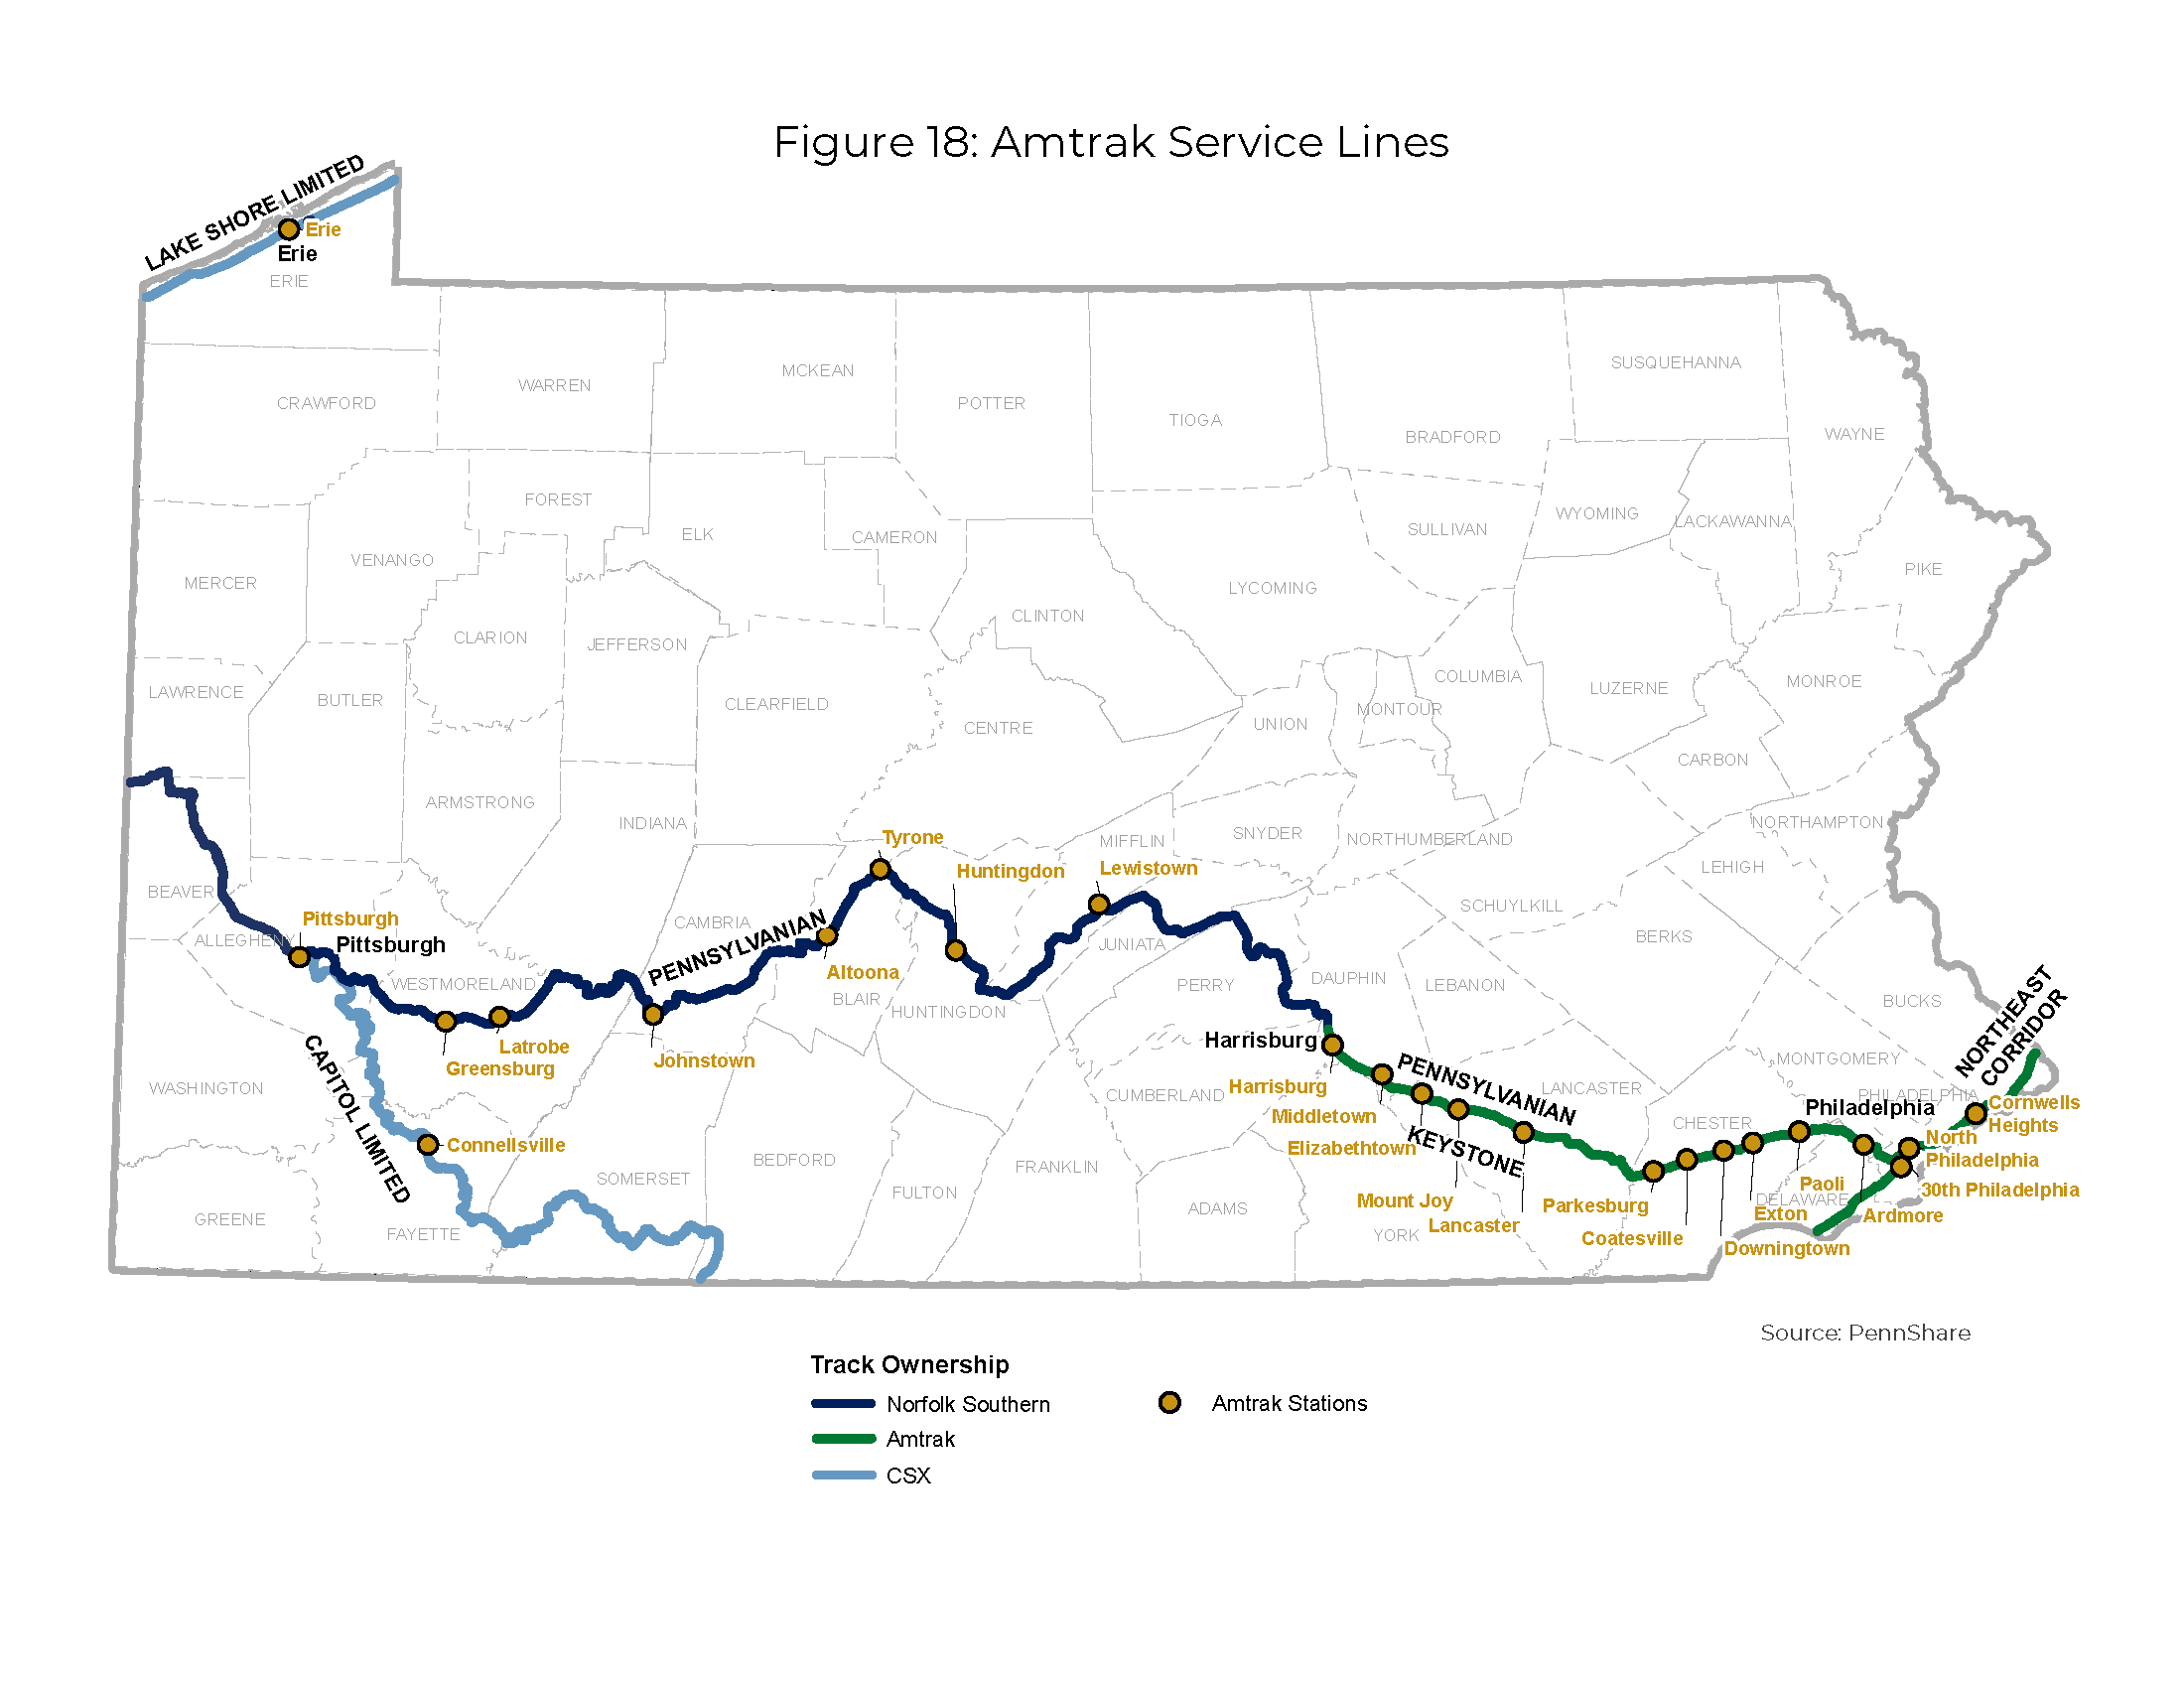
Figure 18 is PennShare's Pennsylvania state map illustrating Amtrack Service Lines and track ownership by Norfolk Southern, Amtrak, and CSX. In addition, the map includes the locations of Amtrak Stations.
Planning Implications
- Population growth across the nation is concentrating in urban areas of all sizes, not just the largest metro areas. This growth encompasses people of all ages who have not demonstrated higher rates of ridesharing and lower vehicle ownership rates, yet may choose passenger rail for their intercity travel needs. Agencies such as SEPTA and the Port Authority of Allegheny County (PAAC) will need to be responsive to this growing customer base to remain viable. The July 2021 Transportation Revenue Options Commission strategic funding proposal includes potential revenue sources that can expand public transportation funding.
https://www.penndot.gov/about-us/funding/Pages/TROC.aspx
- Higher-density, mixed-use development associated with transit systems (i.e., transit-oriented development), has been a focus of community and economic development planning in Pennsylvania's small- to mid-size rail-served urban areas, though it is far outpaced by low-density, auto-dependent residential development at the edge of existing development. In order to control costs, address climate change, and manage growth responsibly, there should be more high density and active transportation-suited development, as well as infill development within existing low-density areas for greater efficiency.
- The State Rail Plan identifies an investment of capital projects totaling $4.5 billion between 2021 and 2045. In addition, there are $1.0 billion worth of “vision projects” for which implementation dates are yet to be determined.
- The future COVID-related impacts on commuting and travel patterns are not fully known but will need to be considered as program planning and delivery become ever more dynamic.
- A 2019 Transportation Advisory Committee study on intercity rail can provide a useful baseline or starting point for any reexamination of potential future service—particularly in light of the potential for more federal investment in intercity passenger rail.
Figure 19: Amtrak Passengers in Pennsylvania, Boardings and Alightings, FFY 2012–2019
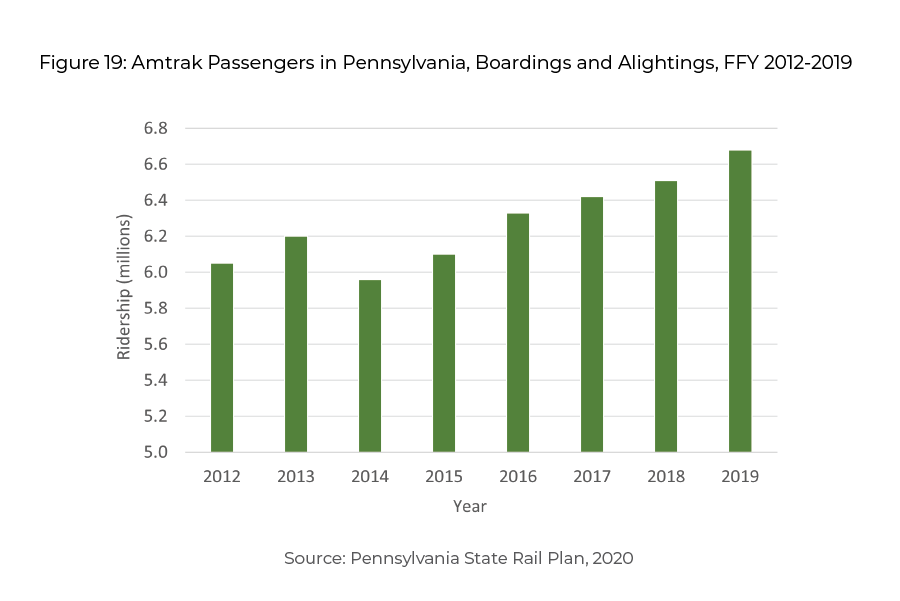
Figure 19 is a bar chart from the 2020 Pennsylvania State Rail Plan Bar chart illustrating Amtrack passenger ridership by the millions from Federal Fiscal Year 2012 through 2019.
The Delaware Valley Regional Planning Commission (DVRPC) projects that the SEPTA Regional Rail network with grow by 8,730 person trips (7.3 percent) and by 9,176 passenger miles (5.2 percent) from 2020 to 2045.
Active Transportation
Trends & Issues
- Active Transportation is any self-propelled, human-powered mode of transportation, (such as walking and/or bicycling). Use of the term “active transportation' highlights the growing recognition of the connection between public health outcomes and transportation planning.
- PennDOT's Active Transportation Plan outlines a vision and framework for improving conditions for walking and bicycling across Pennsylvania, most notably for those who walk and bicycle out of necessity rather than for leisure and recreation. Pennsylvania's active transportation network and recreation spaces link communities, connect children to the outdoors, and serve as economic engines for small towns and big cities looking to attract tourists. Improved and expanded bicycle and pedestrian facilities also support improved community health outcomes and ensure flexibility and resiliency in the face of climate change.
- The COVID-19 pandemic highlighted the value of our non-motorized transportation network. Communities statewide experienced an increased need for safer and more accessible walking and bicycling infrastructure as more Pennsylvanians began walking and bicycling to parks, trails, grocery stores and other community resources.
- According to the Pennsylvania Environmental Council, when tracking the use of 67 trails, parks, and natural areas around the state, activity spiked by as much as 200 percent during March and April 2020 over the same period a year earlier. Demand remains elevated with many new users inclined to continue with greater levels of physical activity.
- The Commonwealth has 11 BicyclePA routes (Figure 20). Pennsylvania's first nationally designated bicycle route, U.S. Bicycle Route 50, is a 163-mile bicycle route designated in May 2017.
- Results from a 2018 public survey for PennDOT's Active Transportation Plan showed that 30 percent of respondents found it “challenging” or “very challenging” to walk in their community, while 58 percent found it challenging or very challenging to ride a bicycle in their community. Additionally, most respondents indicated that physical infrastructure such as separated bicycle lanes, sidewalks, and a connected non-motorized network was needed for them to consider walking or bicycling more frequently.
- Funding opportunities for trail planning and development have increased significantly. Between 2009 and 2014 the Pennsylvania Department of Conservation and Natural Resources (DCNR) awarded $45.6 million for 317 trail projects. In 2018 the agency funded the completion of one of the state's major trail gaps, 16.8 miles of new non-motorized trails, 22 miles of rehabilitated trail, and planning for another 7.4 miles of future trails. Trails and gaps are mapped on Figure 21.
- Funding opportunities are also available through the Multimodal Transportation Fund and the Transportation Alternatives Set-Aside Program—new sources that are being used extensively by municipalities and other eligible sponsors to improve walking and bicycling accommodation.
Planning Implications
- PennDOT and its state, regional, and local partners must coordinate efforts and leverage existing and new resources to improve the current policies, legislation, funding, and infrastructure intended to support active transportation.
- Public health and public interest will continue to translate into growing support for investments that expand active transportation.
- There are numerous plans and programs being undertaken at the county and municipal levels that are increasing the public's access to facilities and activities focused on active transportation. Growing public support is a key factor in future planning and investment decision-making.
Figure 20: BicyclePA Routes
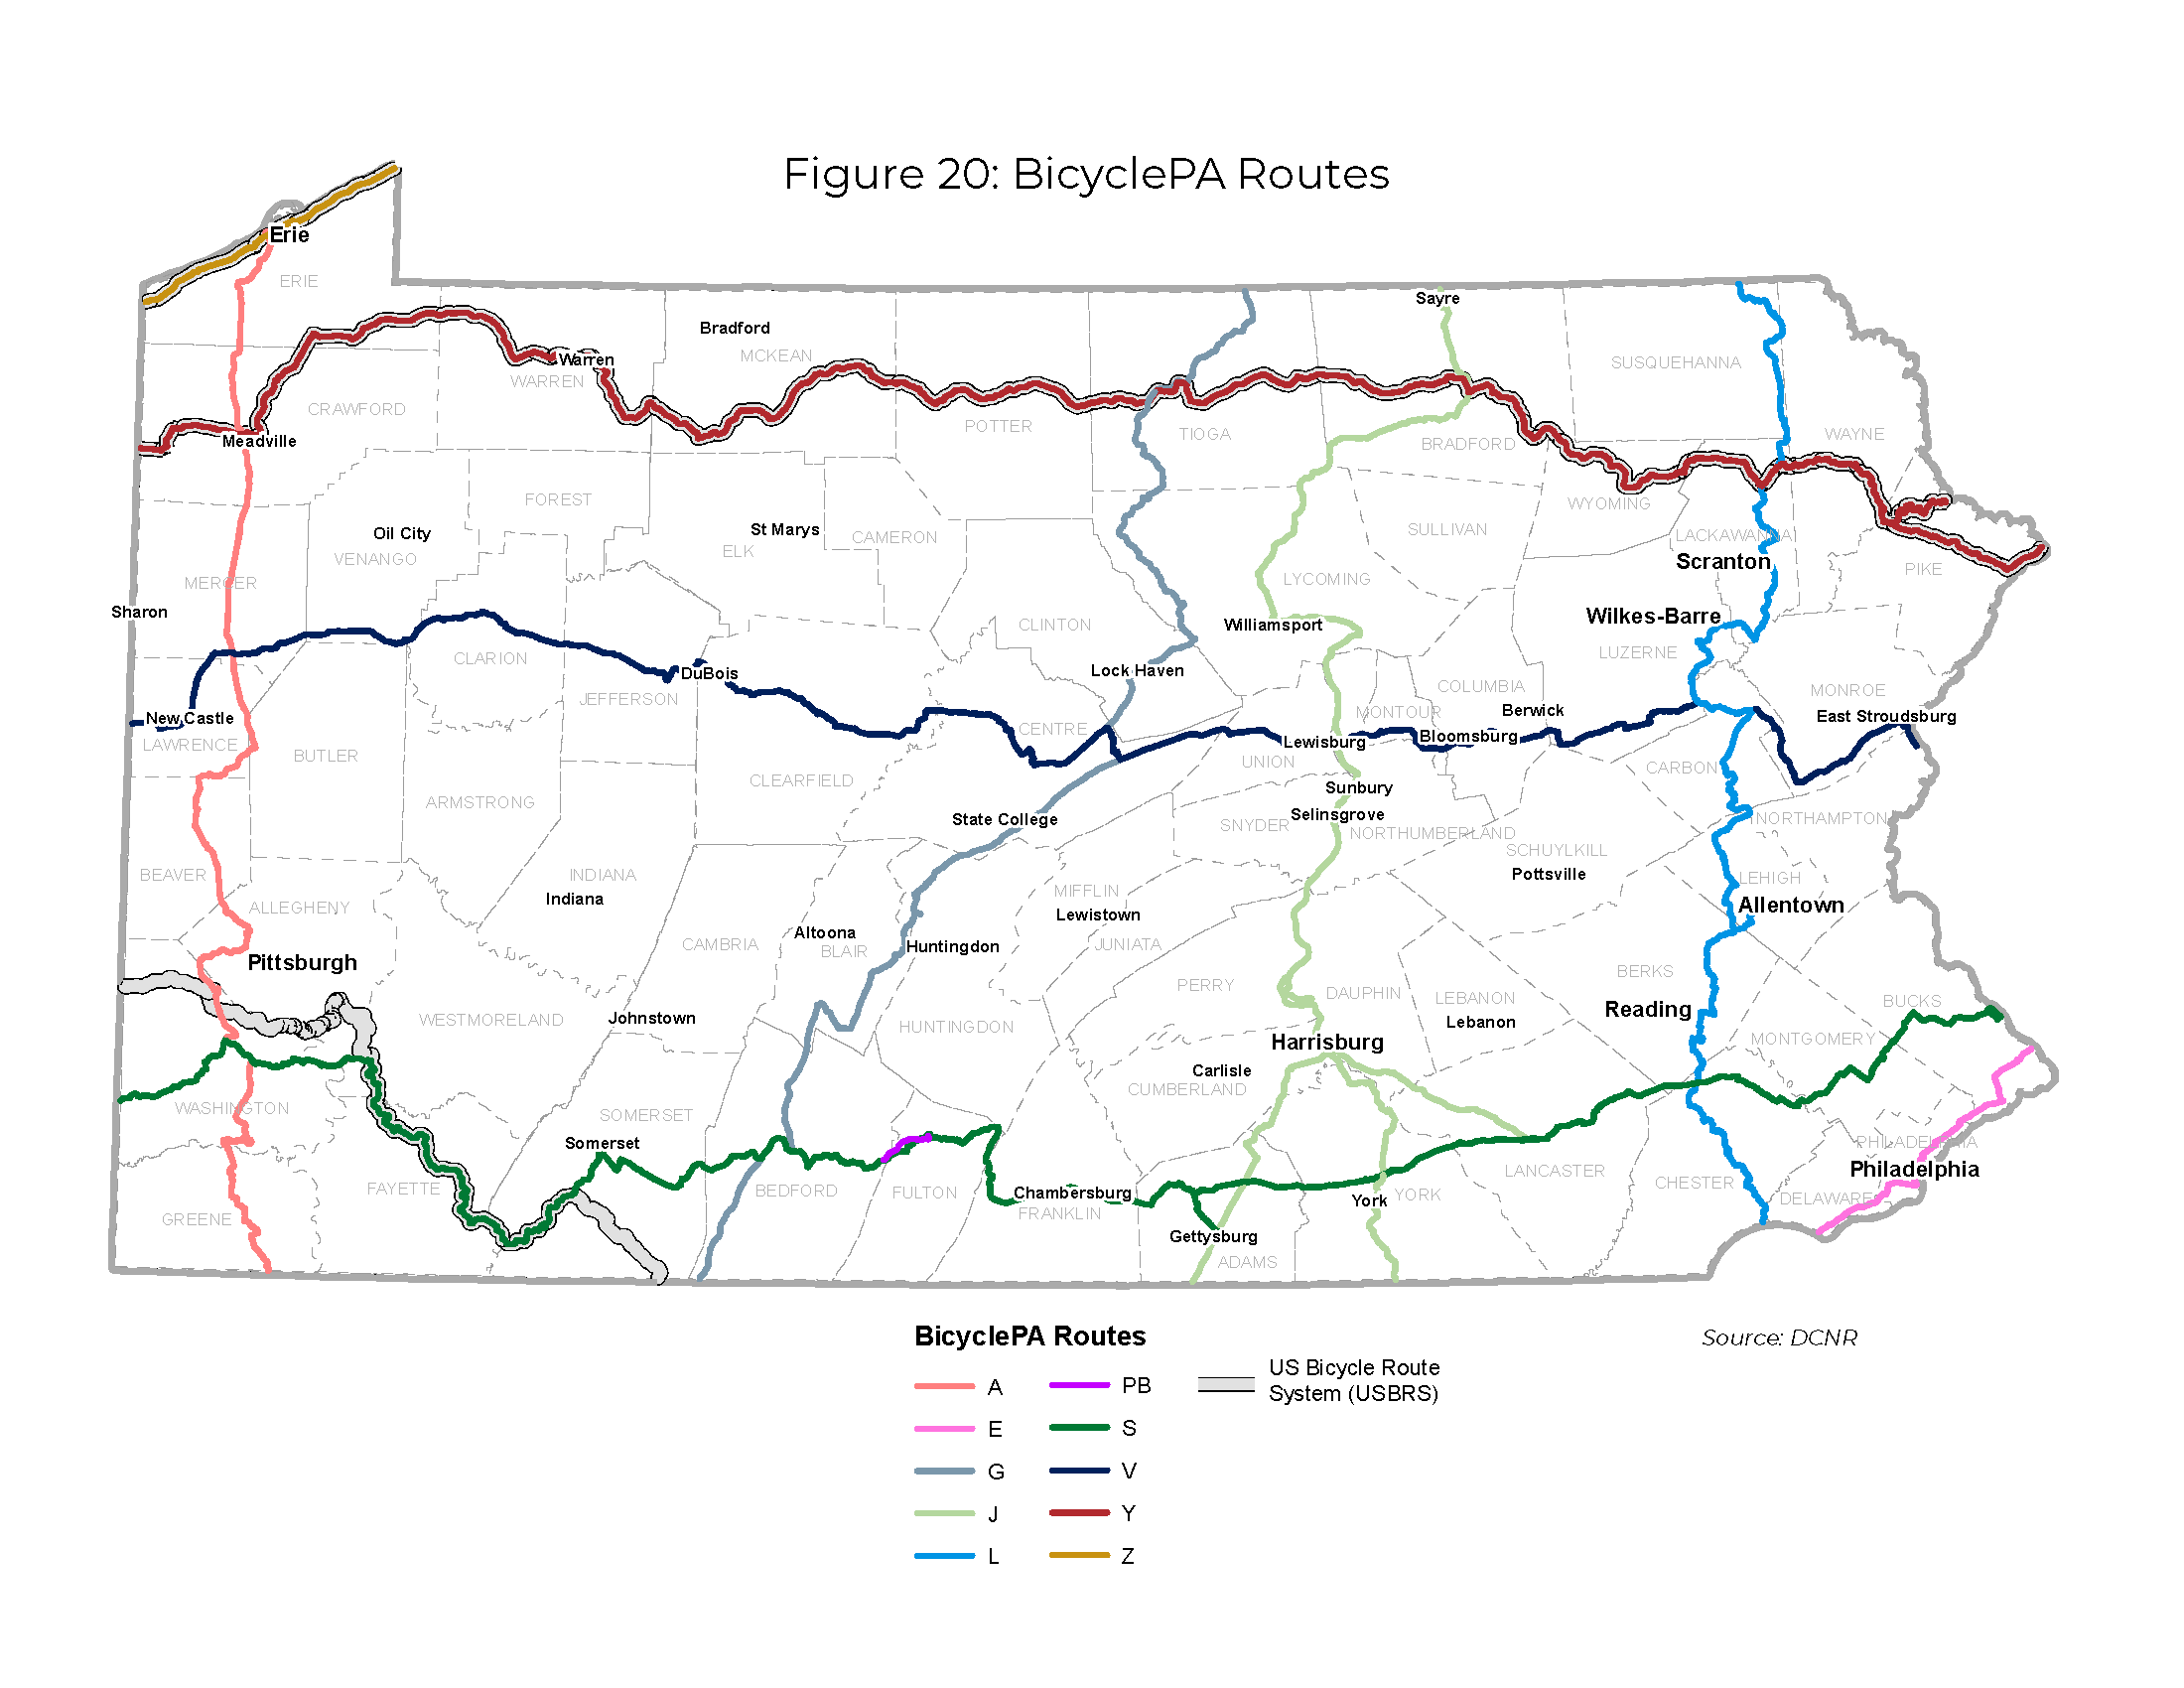
Figure 20 is PennDOT's map of Pennsylvania depicting the BicyclePA Routes of A, E, G, J, L, PB, S, V, Y, Z and the US Bicycle Route System.
Figure 21: DCNR Trails and Trail Gaps
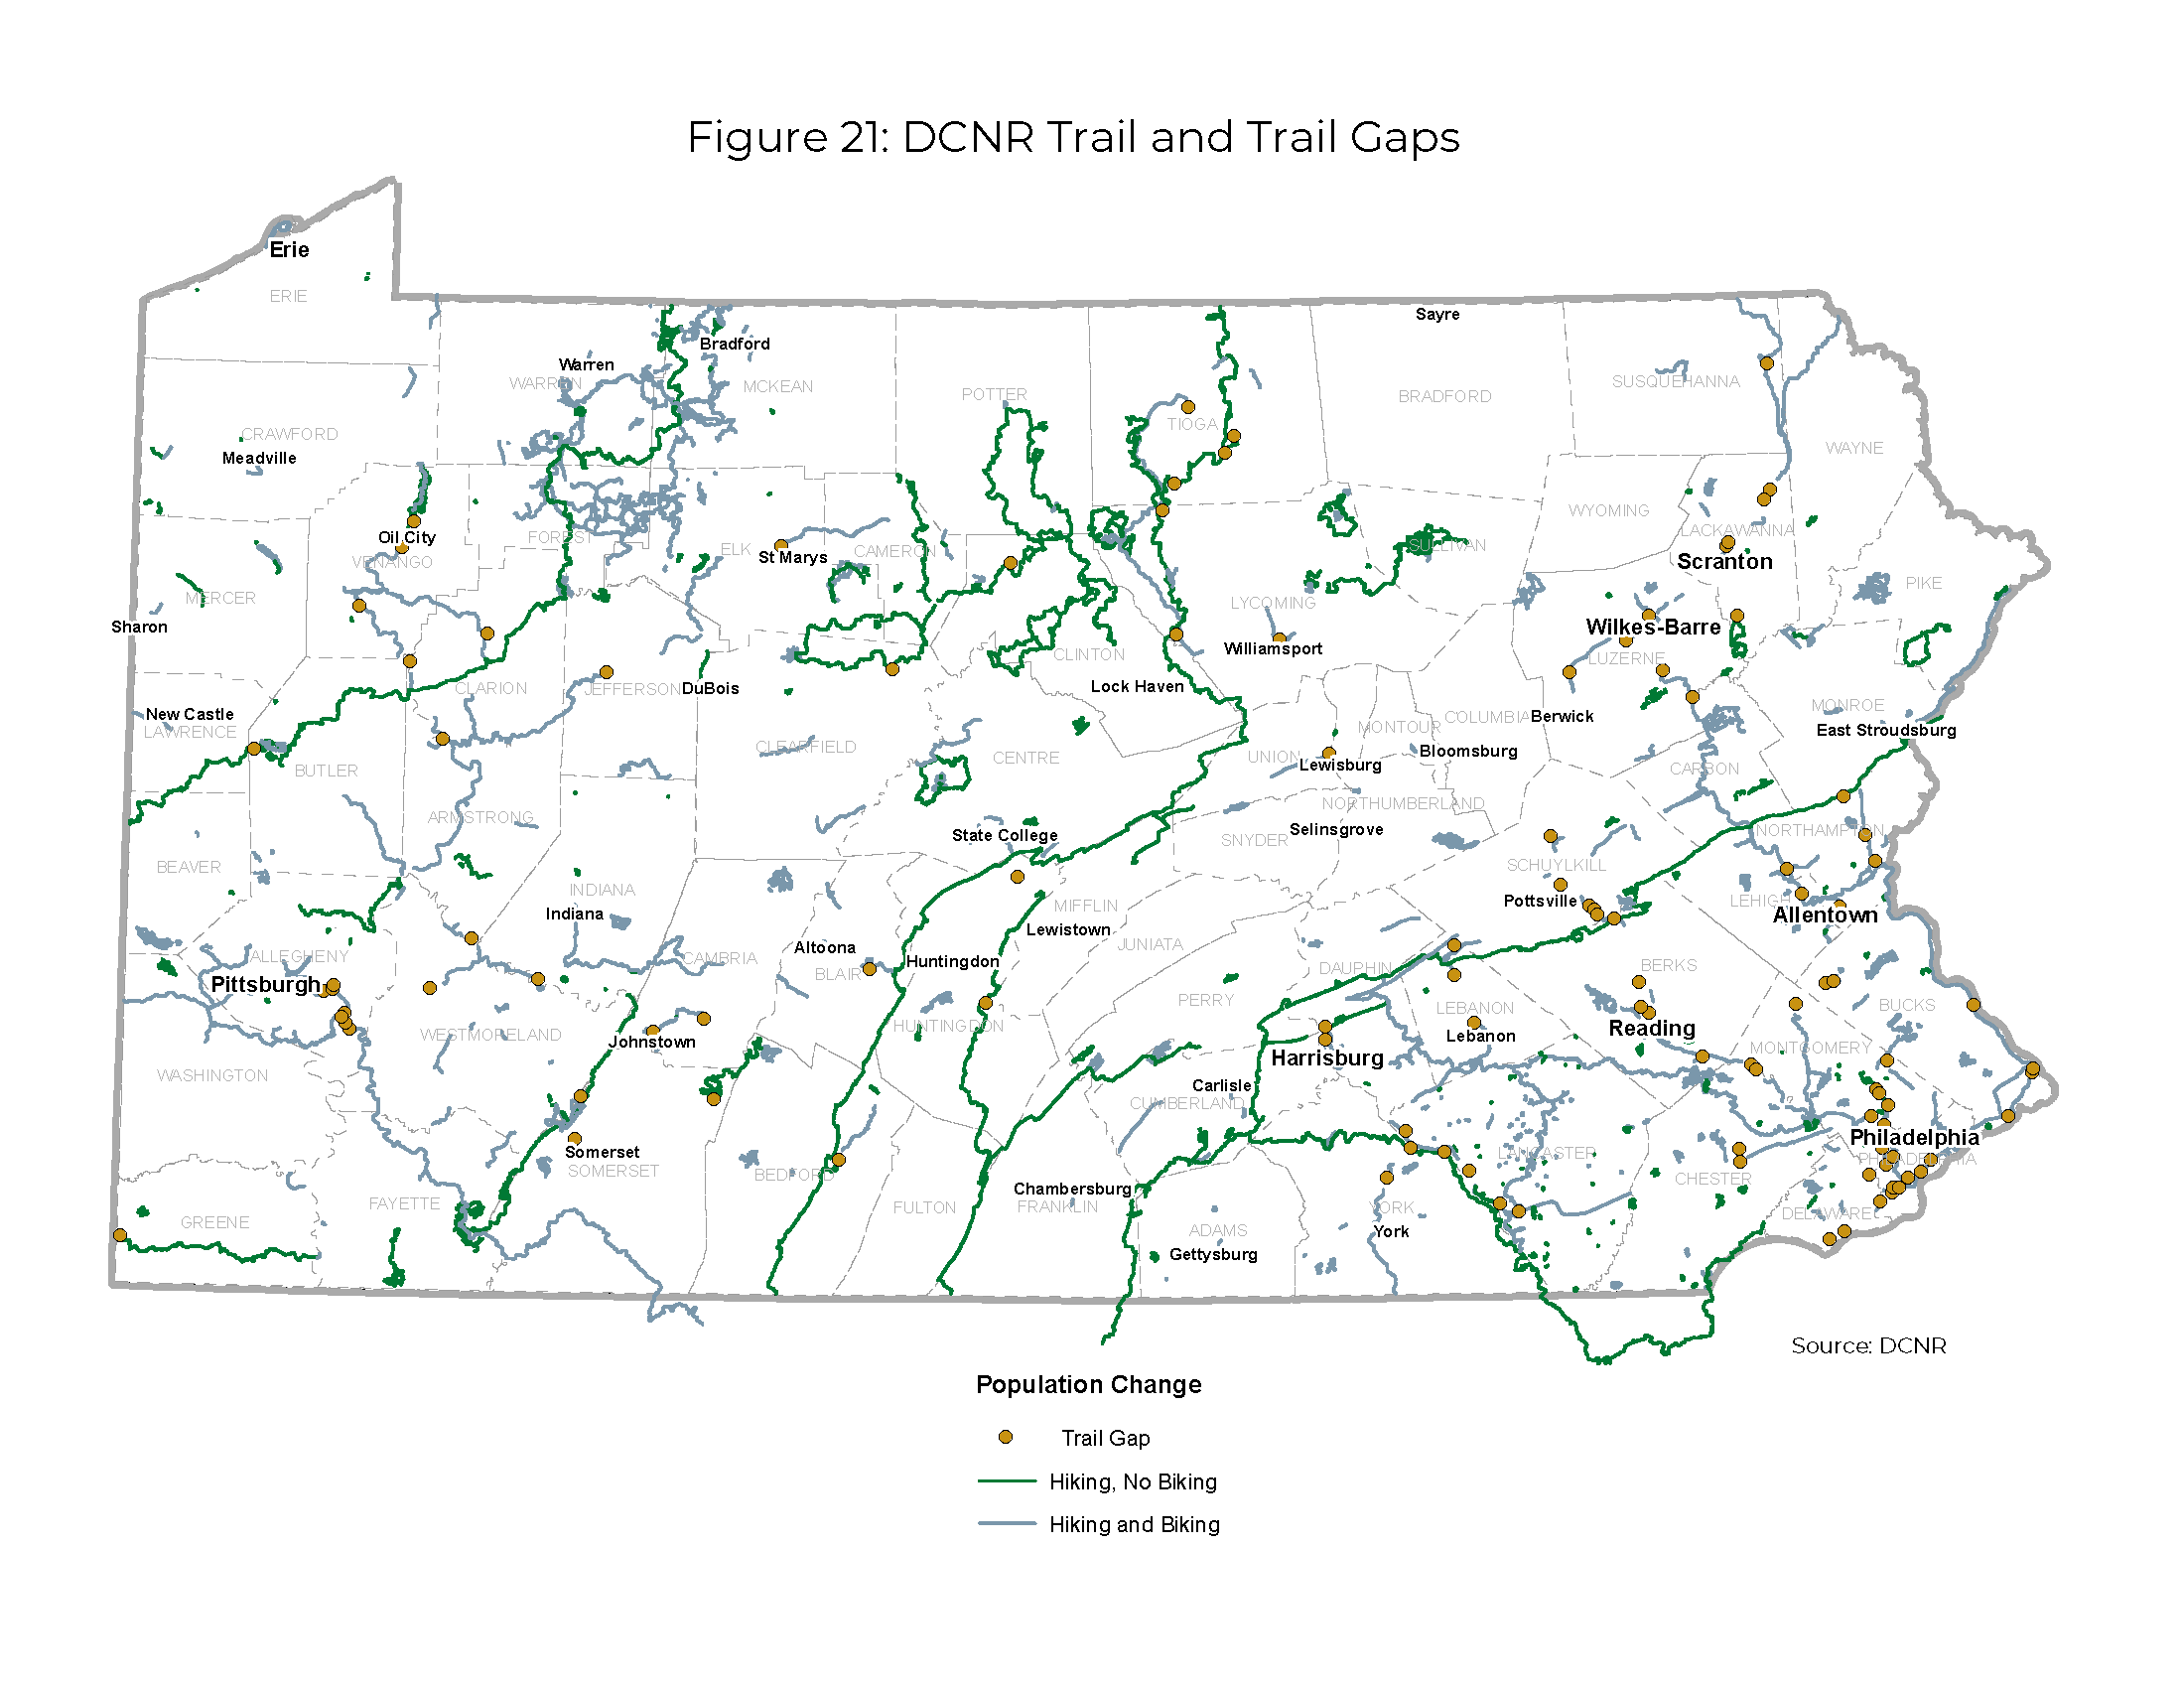
Figure 21 is a DCNR map of Pennsylvania illustrating DCNR Trails with hiking and no biking, hiking and biking allowed and trail gaps.
PennDOT's 2019 Active Transportation Plan outlines a vision and framework for improving conditions for walking and bicycling across Pennsylvania, most notably for those who walk and bicycle out of necessity rather than for leisure and recreation.
Aviation
Trends & Issues
- There are approximately 655 aviation facilities across Pennsylvania. These include 123 licensed public-use airports, including three heliports and two seaplane bases, as well as 230 private-use airports and 282 private-use heliports.
- Of the public-use airports, 14 are commercial service airports (Figure 22), which are also used for air freight; the remaining 113 are general aviation airports offering on-demand air transportation service.
- According to the 2019 Interim Aviation Economic Impact Study, Pennsylvania's commercial and general aviation airports provide an annual economic impact of $28.5 billion to the state. As would be expected, the state's 15 commercial airports generate most of the economic activity, at approximately $26.7 billion (Figure 23).
- In 2018, there were 21.7 million air carrier enplanements in Pennsylvania—a 10-year increase of 0.9 percent.
- The COVID-19 pandemic has had both a public health and economic impact, drastically reducing air travel operations in 2020. The full impact and recovery timeline of this public health emergency is not yet known, though it may be longer than previous recoveries due to its worldwide impact.
- Although forecasts indicate a rise in based aircraft and operations, there is sufficient capacity system-wide to accommodate future growth.
- Of the three factors that have influenced statewide airport operations and development, namely increasing fuel costs, protection of airspace and runway approaches, and community disposition toward airport development, PennDOT's Bureau of Aviation has been active in promoting airport hazard zoning to protect airspace. A 2020 review of Pennsylvania Bureau of Aviation data found that compliance has increased to 47 percent of affected municipalities.
- Air cargo revenue ton-miles increased both domestically and internationally between 2009 and 2019, by 36.5 percent and 105.5 percent, respectively.
Planning Implications
- With estimates of a near-doubling of passenger and cargo numbers by 2036, airport infrastructure improvements are needed, and can be expected to support airport job growth.
- Regarding commercial activity, Philadelphia International Airport (PHL) could face major operational challenges. While the introduction of larger aircraft may result in the consolidation of flight schedules, the airport's airspace remains congested. General aviation and reliever airports in southeastern Pennsylvania help reduce congestion in and around the PHL airspace and minimize delays for non-commercial activity.
- Three constrained general aviation service airports—Doylestown, Heritage Field, and Brandywine—should be upgraded where possible to continue meeting regional demand, especially because aircraft operations in Eastern Pennsylvania are forecasted to grow faster than the state's average.
There is a strong relationship between enplanements and the economy. The economic downturn of the early 2000s following September 11, 2001, and the Great Recession of 2007-09 had a profound effect on the level of air traffic in the U.S. The pandemic also greatly reduced enplanements.
Figure 22: Commercial Public-Use Airports
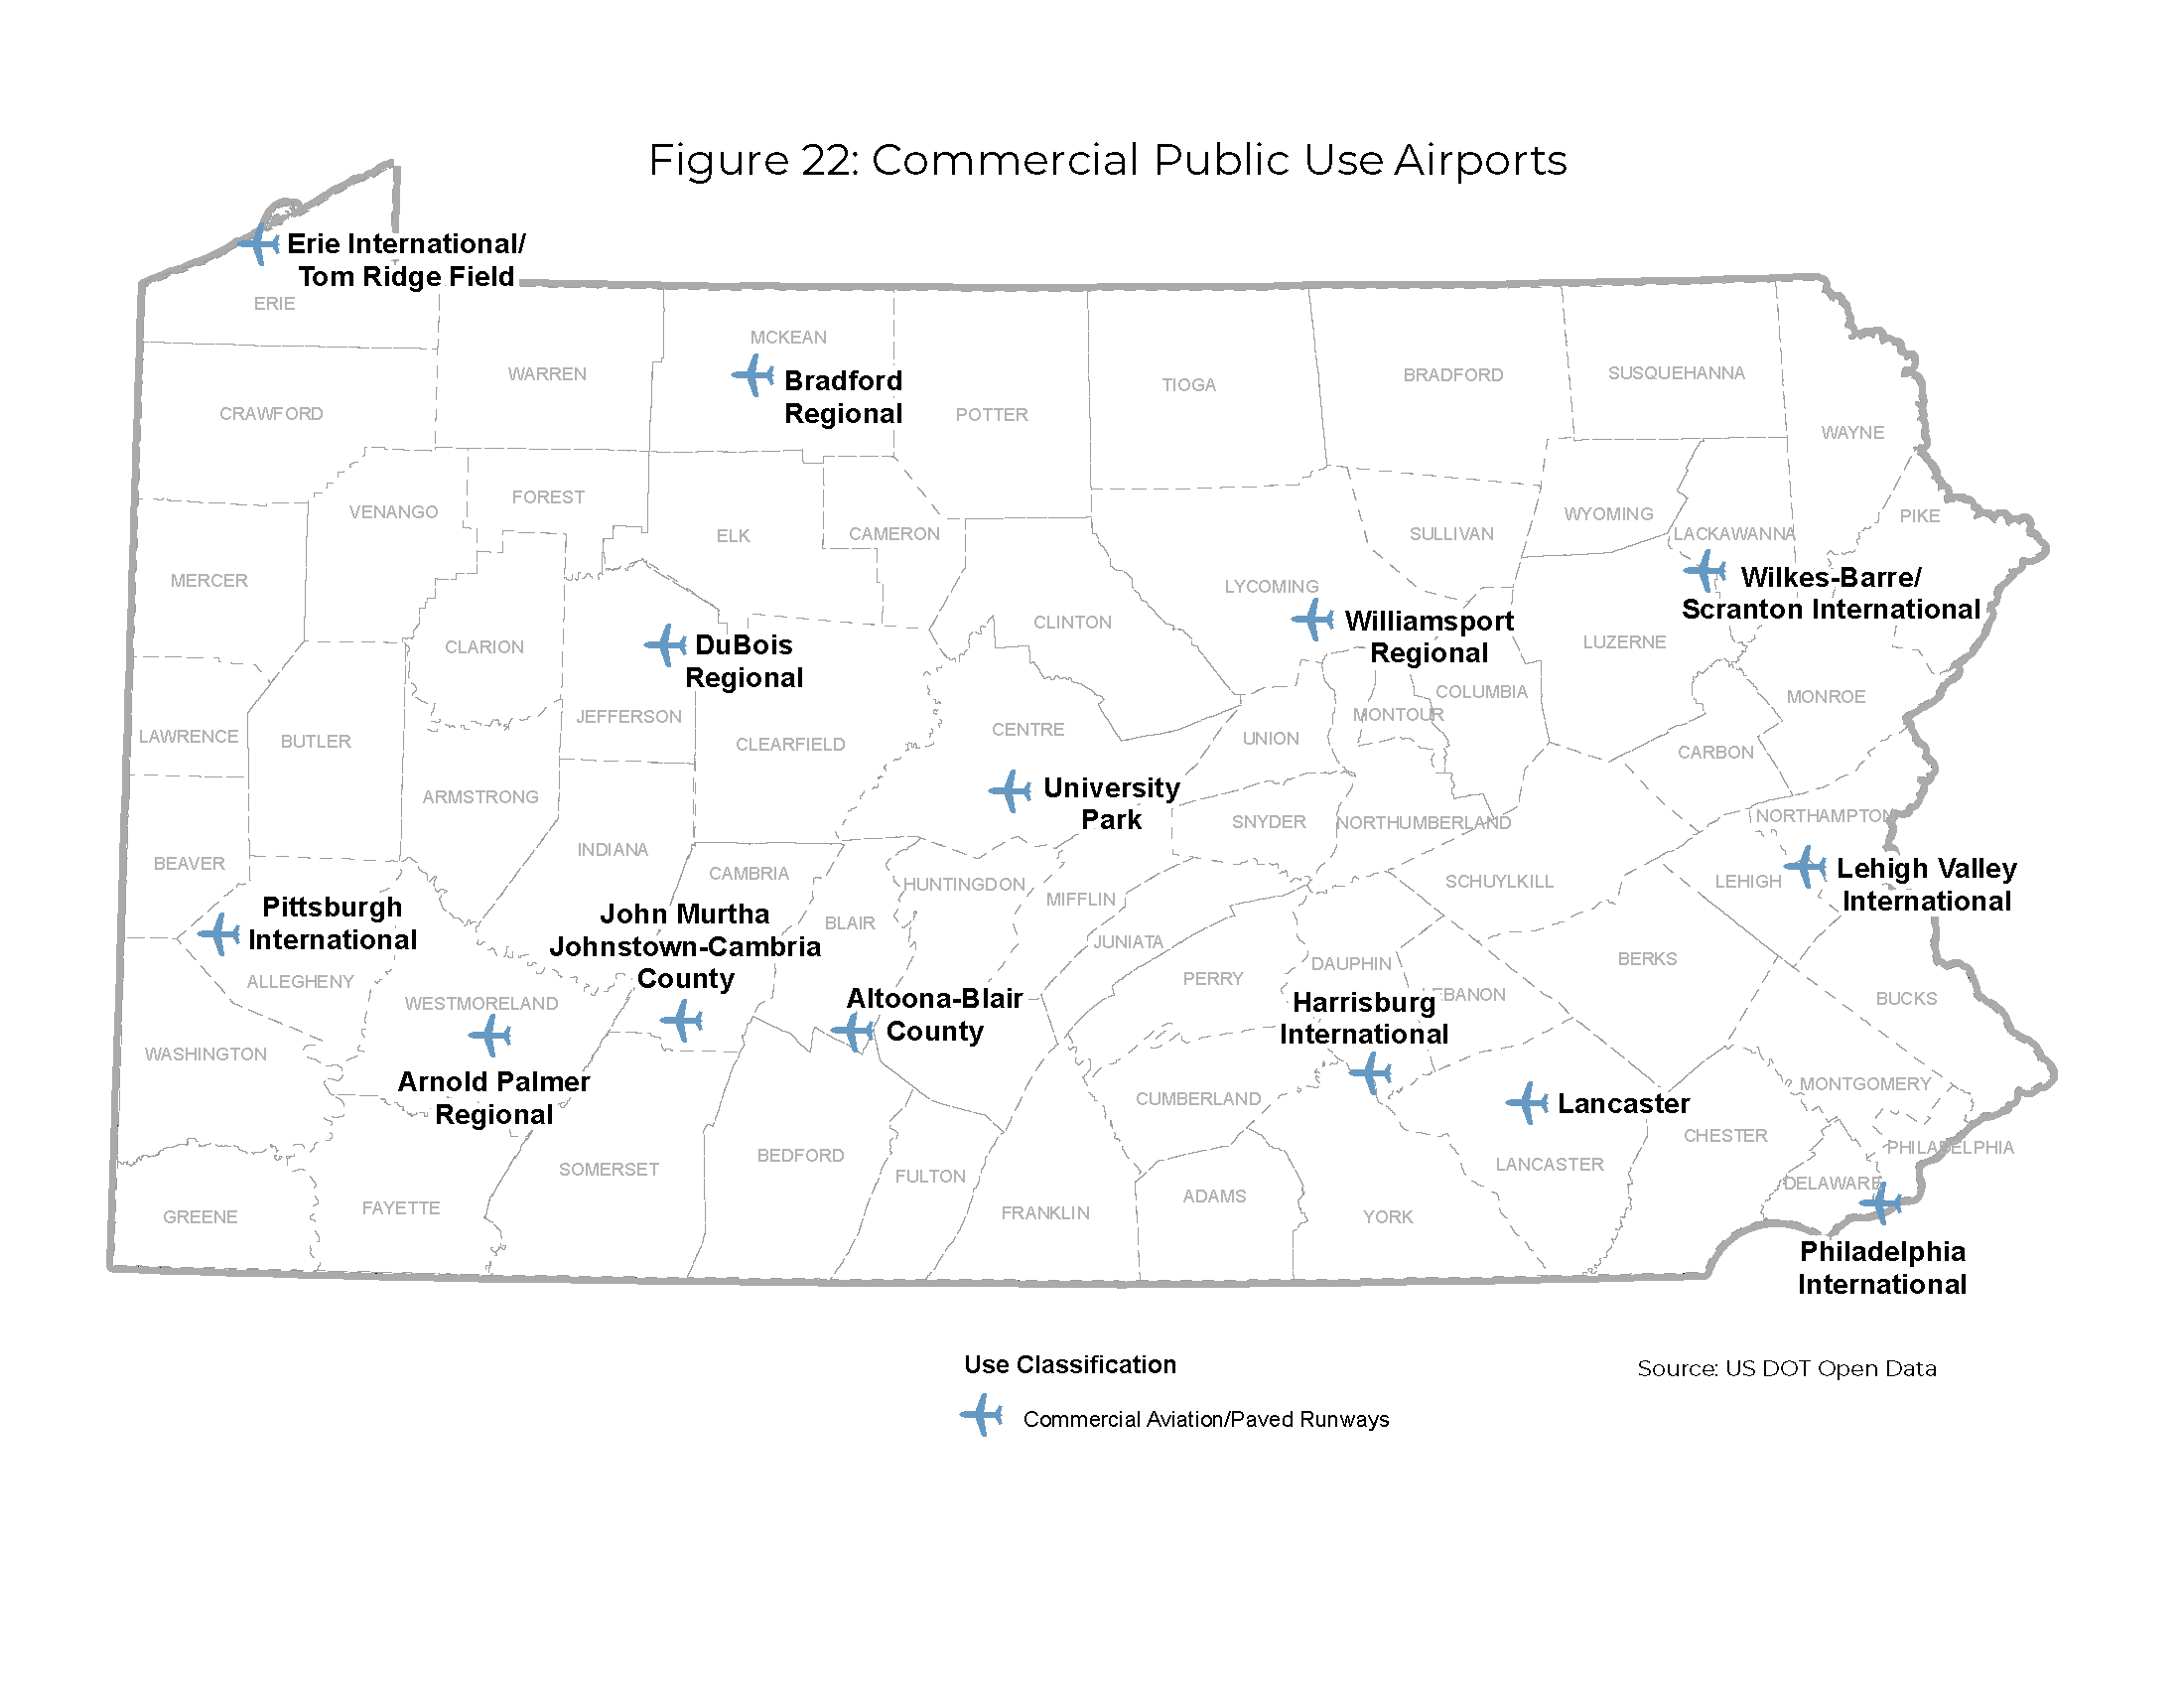
Figure 22 is a U.S. DOT Open Data map of Pennsylvania showing the 14 Commercial Aviation/Paved Runway airports across the state.
Figure 23: Economic Impact of Commercial Airports in Pennsylvania, 2019
| Airport | Economic Impact, 2019 | Percent of Total |
| Philadelphia International Airport | $16,561,963,000 | 62.0% |
| Pittsburgh International Airport | $7,011,038,532 | 26.2% |
| Harrisburg International Airport | $1,017,571,000 | 3.8% |
| Lehigh Valley International Airport | $547,725,000 | 2.1% |
| Wilkes-Barre/Scranton International Airport | $452,138,000 | 1.7% |
| All other commercial airports | $1,126,827,000 | 4.2% |
| Total Estimated Economic Impact | $26,717,262,532 | 100.0% |
| Source: PennDOT Bureau of Aviation – Economic Impact of Aviation in Pennsylvania Report (2019 Interim Update) |
There are approximately 655 Aviation Facilities across Pennsylvania. These include 128 licensed public-use airports, including three heliports and two seaplane bases, as well as 243 private-use airports and 284 private-use heliports.
Connected and Automated Vehicles (CAV) and Technology
Trends & Issues
- There are many initiatives currently underway that aim to prepare for the introduction of Connected and Automated Vehicles (CAVs) to the U.S. and Pennsylvania's roadways. These initiatives include research and testing of Highly Automated Vehicles (HAVs), public outreach and education, and developing legislation to govern the safe operation of these vehicles.
- PennDOT is responsible for many CAV initiatives and is a leader in the national effort to develop standards and practices through its participation in multiple USDOT and national committees, and through initiatives such as PennSTART, the Statewide Connected and Automated Vehicle Strategic Plan, and the Smart Belt Coalition.
- In addition to personal vehicles, other roadway user types such as freight haulers are rapidly transitioning to a more automated fleet of vehicles. The freight sector is likely to be the earliest adopter of the technology due to the cost savings and driver shortages. As a national hub for freight movement, improvements in freight transportation will be directly beneficial to the Commonwealth.
- Pennsylvania's first automated vehicle legislation, Act 117 of 2018, allows for the platooning of up to three vehicles on public roadways. Platooning could potentially increase the amount of freight moved by a single driver by enabling the driver to operate a fleet of up to three trucks, buses, or military vehicles.
- In addition to managing the research and testing of HAV technology, PennDOT has also convened three PA Autonomous Vehicle Summits to explore the future potential of automated vehicles.
- Beyond CAV, PennDOT has been recognized for other technological advances through awards such as the operational excellence award for the Automated Work Zone Speed Enforcement and the best use of technology award for the Shaler Street Bridge Replacement in Pittsburgh.
Planning Implications
- An increase in new technologies on roadways will change physical aspects of the nation's transportation network and operations such as traffic patterns, land use, travel volumes, curbside management, use hours of vehicles, and roadway design. Future PennDOT guidelines and publications will need to accommodate these changes.
- The Pennsylvania Automated Vehicle Strategic Plan (2018) outlines four pilot projects that are advantageous to implement in the near term to assist with the shift toward automation. These pilots will need to be implemented to better help identify understand the changes that will be needed to adapt the current transportation system to a more automated future.
- A number of potential challenges emerge as widespread implementation of new technologies could completely change traffic infrastructure needs and traffic patterns. Some challenges include significant funding needs, ownership and maintenance, timing of implementation, and accessibility.
As of November 2021, there is no legislation allowing autonomous vehicles to operate on PennDOT roadways. However, PennDOT has produced guidance for vehicle testers to safely experiment with their products with a human driver behind the wheel. Development of legislation can be a long process that can impede implementation of new technologies
Freight Rail
Trends & Issues
- Freight Rail Pennsylvania's freight railroad activity ranks among the leaders across the U.S. by several measures, including the number of railroad companies operating in the state, track mileage, tonnage, car loadings, employment, and total compensation for railroad employees and retirees.
- While freight rail is primarily a private sector transport mode, the public benefits are considerable and have been the basis for state investment for a long time. Chief among these benefits is the reduction of highway and bridge demand with mode shift to rail.
- The Pennsylvania freight rail system comprises three general categories established by the Federal Railroad Administration (FRA). These include:
- Three Class I railroads, comprising 47 percent of the route-miles in Pennsylvania
- Three regional (Class II) railroads, with 14 percent of the route-miles
- 57 short-line (Class III) railroads, including local (29 percent of the route-miles) and terminal/switching railroads (10 percent of the route-miles)
- One of the unique elements of the Pennsylvania freight rail network is the Conrail Shared Assets system. After the acquisition of Conrail by Norfolk Southern and CSX in the late 1990s, a remnant of Conrail remained as a switching and terminal railroad in several regions of the Northeast. The railroad is jointly owned by CSX and NS, and in Pennsylvania it operates on more than 65 miles of right-of-way in the Philadelphia area.
- USDOT projects long-term (2018-2045) growth in rail freight in Pennsylvania of 36 percent in tonnage, 23 percent in ton-miles and 129 percent in value. These figures indicate a long-term pattern of growth in activity on Pennsylvania's freight rail system. However, with the exception of the increase in the value of commodities moved by rail, the growth pattern reflected by these USDOT projections is indicative of slower growth in rail freight volumes than in trucking activity.
- Some of the major Class I rail lines in Pennsylvania are used jointly by freight and passenger trains. This shared use of right-of-way presents operational capacity and safety concerns for current and future rail service.
- Highway–railroad grade crossing safety has been a major national railroad safety priority over the years. The 2020 State Rail Plan (SRP) indicates that there are more than 3,500 public grade crossings in Pennsylvania. The Commonwealth has made the elimination of grade crossings (where feasible) a major initiative through the Railway–Highway Grade Crossing (Section 130) Program.
- The Pennsylvania freight railroad network is shown in Figure 24.
Figure 24: Class I Lines and Intermodal Terminals
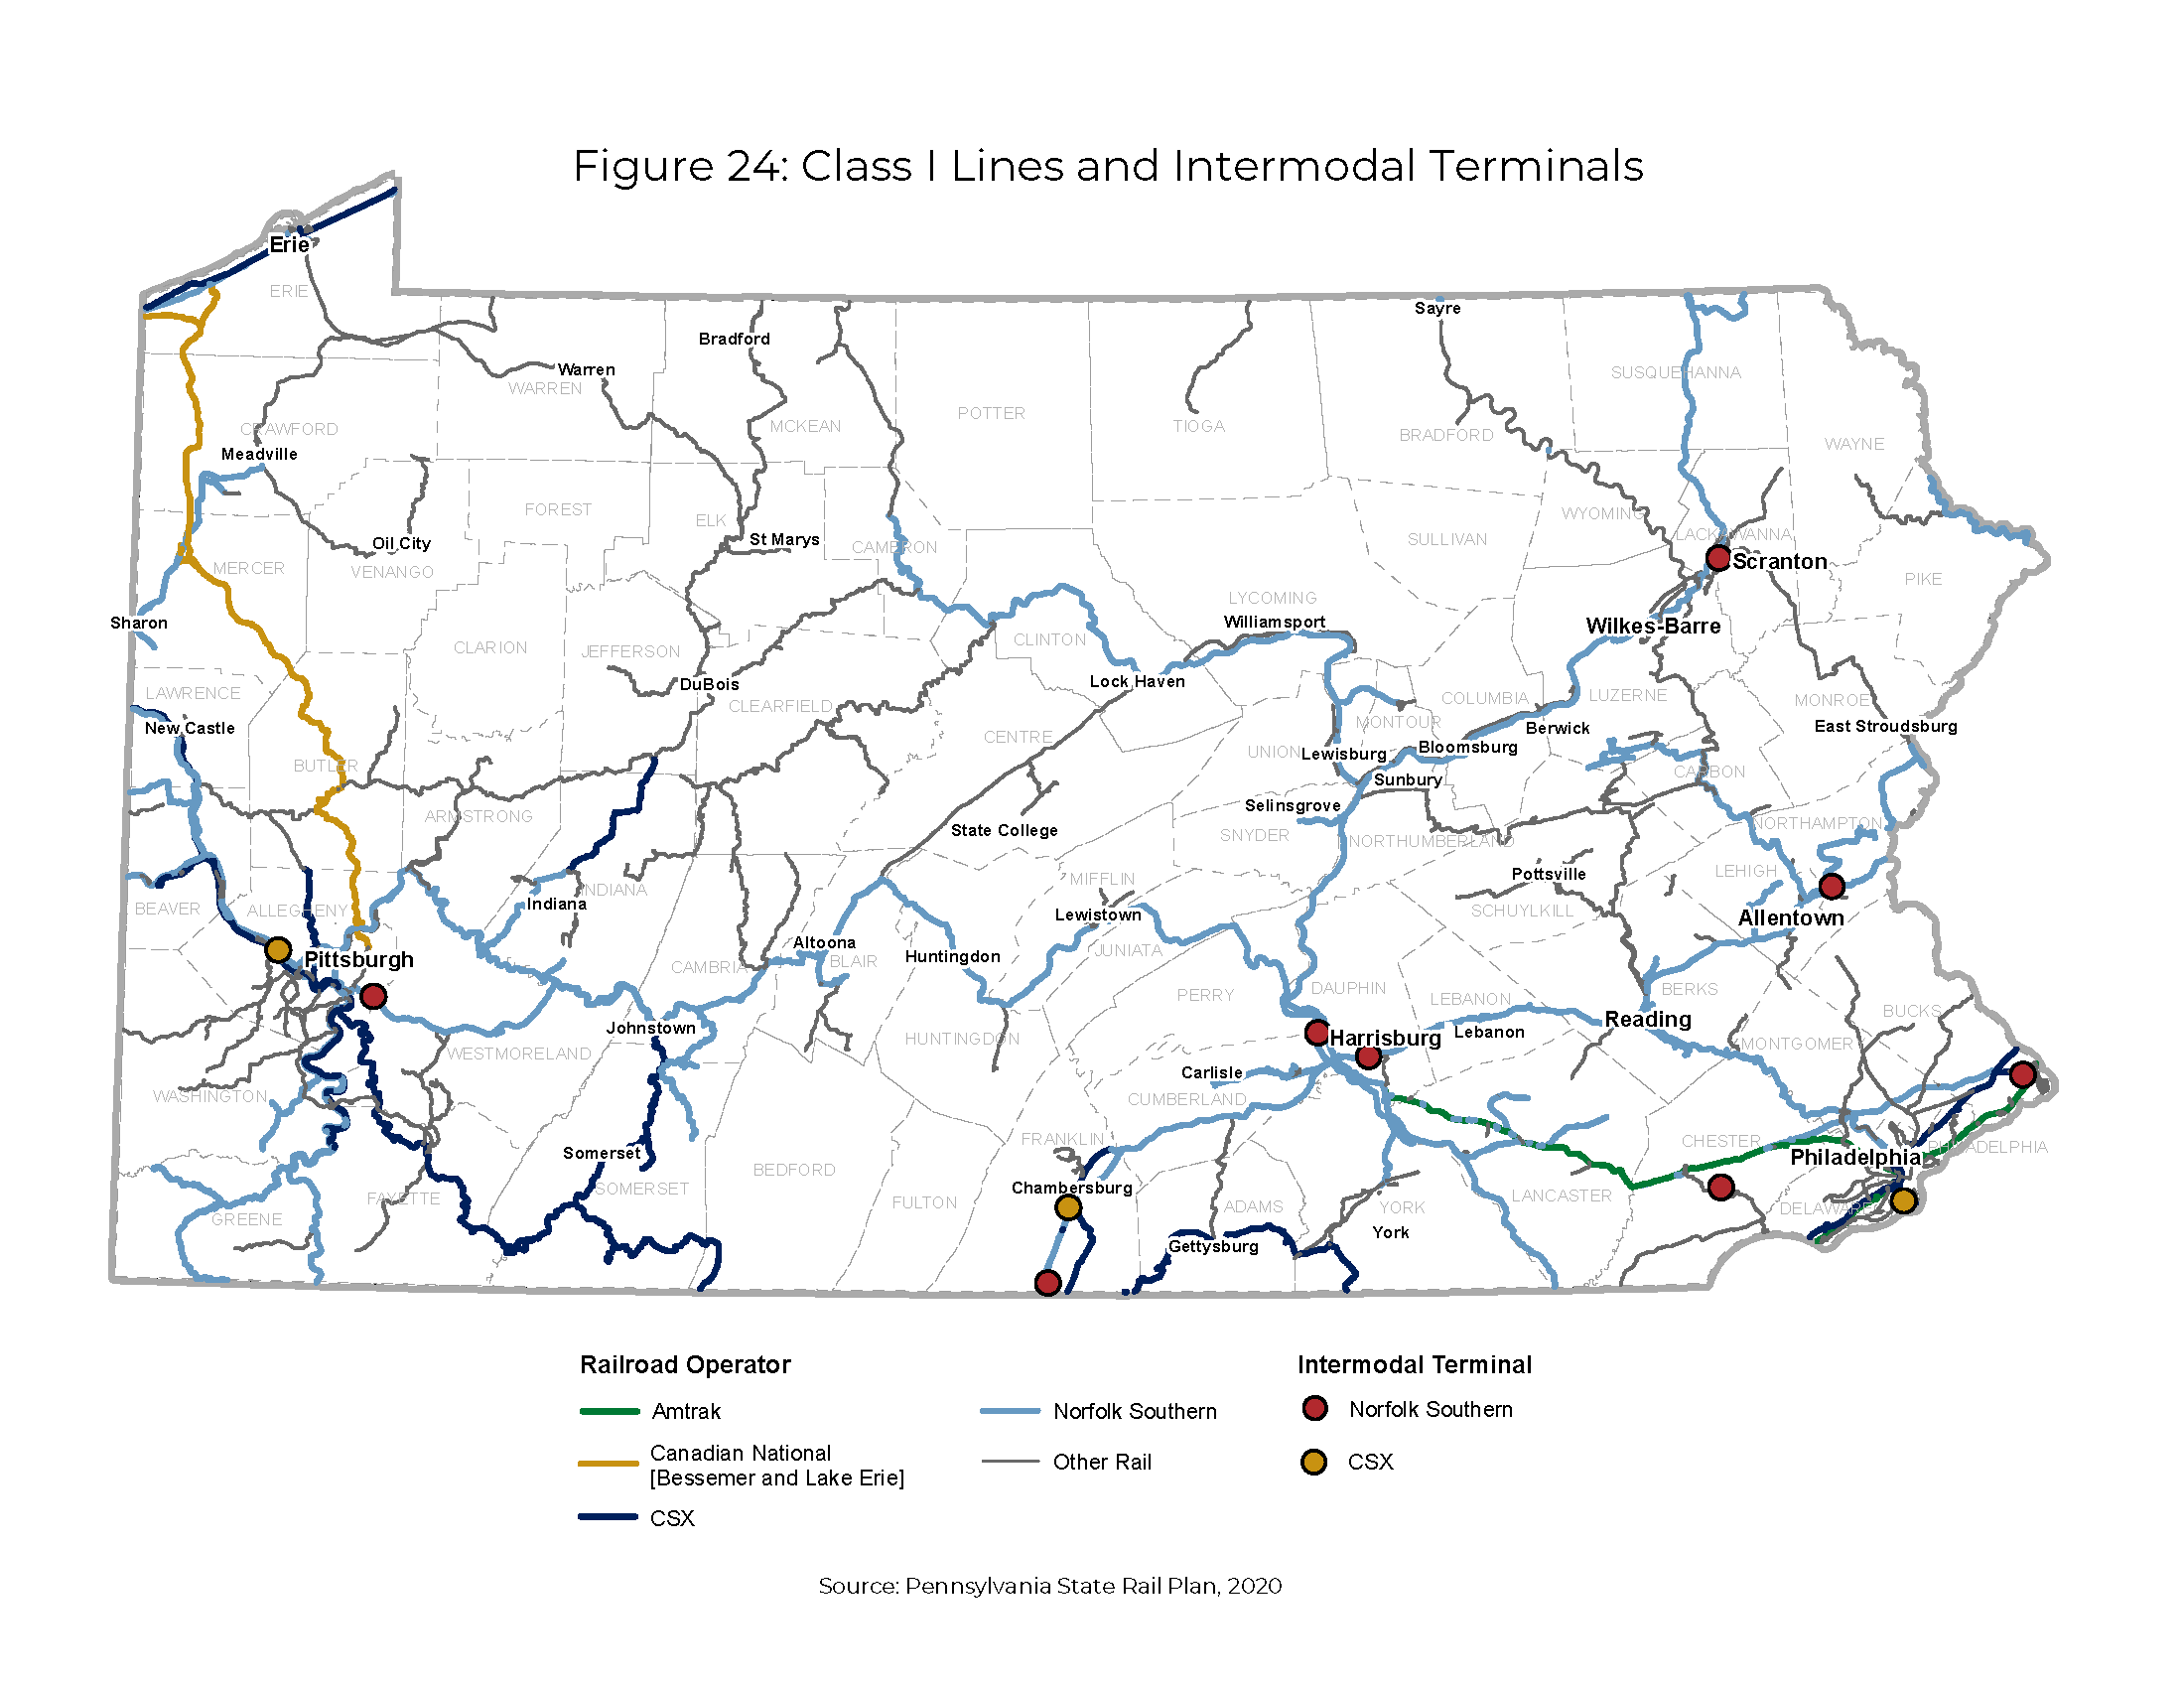
Figure 24 is the 2020 Pennsylvania State Rail Plan state map illustrating the Class 1 lines of railroad operators Amtrak, Canadian National (Bessemer and Lake Erie), CSX, Norfolk Southern, and other rails, as well as the Intermodal terminals of Norfolk Southern and CSX.
Planning Implications
- As a result of the growth in rail intermodal traffic, connections between transport modes have increasingly become bottlenecks in the transportation process over time. Roadside access to marine terminals and intermodal rail yards is critical to the efficient movement of containerized freight.
- On-dock and near-dock rail infrastructure development has been incorporated in major container ports throughout the U.S., and is essential for ports that seek to attract discretionary cargo destined for the interior of North America as a crucial element of their business model. Intermodal connections have been identified as a key issue by stakeholders involved in multiple freight transportation modes, including trucking, air cargo, maritime trade (for both ocean ports and inland waterways), and railroads.
- The 2020 SRP is built around the following vision statement:
Pennsylvania's integrated rail system will provide safe, convenient, reliable, cost-effective connections for people and goods. As a viable alternative to other modes, it will support economic competitiveness, smart growth, environmental sustainability, and resiliency, thereby strengthening Pennsylvania's communities. - The LRTP reinforces this vision statement as it applies to freight transportation. To that end, the goals and objectives of the LRTP align with the eight key goals of the SRP:
- Bring the priority rail system to a state of good repair and maintain it.
- Develop an integrated rail system.
- Support the future needs of residents and businesses.
- Enhance the quality of life in Pennsylvania.
- Ensure personal safety and infrastructure security.
- Support energy efficiency, environmental sustainability, and resiliency.
- Identify stable and predictable funding.
- Build public support for rail system services and assets.
The growth of intermodal freight transportation in the railroad industry has been an ongoing trend that has accelerated in recent decades as global trade in containerized shipments has grown dramatically. This has been coupled with consolidation in the North American railroad industry that has extended the reach of the remaining Class I railroads and improved the competitive position of rail transport of shipping containers versus long-haul trucking on many domestic trade corridors.
Ports and Waterways
Trends & Issues
- Maritime transportation is the most cost-competitive long-distance transportation mode, and water ports provide the essential intermodal connection between waterways and the landside systems that handle final delivery of goods.
- Pennsylvania's three water ports each function uniquely to move domestic and international commerce across deep water, inland, and Great Lakes waterways. The Port of Philadelphia serves Atlantic Ocean vessels and transfers raw materials in bulk, as well as finished goods in containers. The Port of Pittsburgh serves predominantly river barge traffic carrying dry bulk materials for the metal, chemical and energy industries. The Port of Erie connects the interior of North America to international waters along the St. Lawrence Seaway. Its top freight includes aggregates used in construction and specialized equipment for a growing wind power generation market.
- According to USDOT port statistics for 2018, Philadelphia ranks 25th among U.S. ports for overall tonnage and 18th for intermodal containers, while Pittsburgh ranks 13th for dry bulk tonnage.
- PhilaPort and its facilities compete with 12 other ports along the Northeast Corridor. Notably, PhilaPort is the number-one fruit gateway in the U.S., and one of the leading entry points in North America for meat and dairy products. It has nearby access to I-95 and I-76/PA Turnpike and is served by four railroads, making it directly accessible to more major cities by rail and truck than any other port in the United States.
- The shipping channel of the Delaware River has been deepened to 45 feet. The channel depth, bridge heights and passage width represent the limiting constraints for vessel size at the Port of Philadelphia.
- The Port of Pittsburgh is a river traffic district spanning approximately 200 miles of navigable waterways in southwestern Pennsylvania. The Port of Pittsburgh Commission promotes use and landside development of the waterway, and the intermodal transportation system throughout southwestern Pennsylvania. The port district consists of barge industry suppliers and more than 200 intermodal and transloading terminal, and processing facilities. Many of the facilities within the port district serve specific industries, including timber, metals, chemicals and energy.
- There are numerous waterfront industrial sites along the Monongahela and Allegheny rivers upstream of Pittsburgh that represent potential freight-oriented redevelopment opportunities. On the Monongahela River, these sites extend south into West Virginia.
- The Port of Erie is located on the southeast shore of Lake Erie in a natural bay sheltered by the Presque Isle peninsula. The port provides industries in northwestern Pennsylvania with intermodal access to Mid-Atlantic, Mid-West, and Canadian markets across the Great Lakes region, as well as to international markets via Lake Ontario and the St. Lawrence Seaway. A port-owned rail spur connects the dock face and shipyard to the CSX mainline about a half-mile from shore. The Bayfront Parkway provides roadway connections to I-79 and I-90.
Planning Implications
- Pennsylvania's water ports are major economic generators. Freight planning at the state, and regional generators must focus on ways to support the efficiency and effectiveness of our water ports. This includes roadway connections and other investments that help to keep the ports competitive.
- Recent infrastructure investments under PhilaPort's Port Development Plan (2016), including new warehouses, cranes, and floodplain mitigation, have been made toward a goal of doubling container and automobile processing capacity, and increasing breakbulk volume by more than 20 percent. Yet fixed barriers, such as the Ben Franklin Bridge (limiting air draft to 135 feet), and I-95 and Amtrak rail lines (limiting landside accessibility), impact port accessibility and efficiency.
- Due to its location at the eastern reaches of the Ohio River system, port district operations at the Port of Pittsburgh area are heavily impacted by lock and dam closures downstream to address maintenance, and repairs. The downstream locks and dams outside Pennsylvania represent the bottlenecks in the inland waterway system. Automated locks in Pittsburgh will be tested to increase goods movement while decreasing the cost of operations.
- Waterfront land ownership is a key factor for port activity, while connectivity to inland facilities influences operational efficiency for cargo distribution. Land use and development opportunities at all three Pennsylvania ports are important considerations for expanding their operations, and providing for potential expansion opportunities.
- Multimodal transportation access and intermodal connections to port facilities are critical elements of an efficient, environmentally sound freight transportation system. Improvements to first-mile/last-mile truck access to waterfront properties and on-dock rail capabilities should be encouraged, and promoted where feasible.
- The USDOT and the Maritime Administration outlined a policy framework for improving the maritime transportation system in Goals and Objectives for a Stronger Maritime Nation: A Report to Congress (February 2020). The policy framework establishes that maritime transportation is essential to national security and economic prosperity, and requires workforce, infrastructure and industry innovations to serve the nation's interests.
Environmental Issues
Trends & Issues
- Pennsylvania's forests, mountains, lakes, and streams provide an abundance of recreation, aesthetic, economic, and environmental resources. Pennsylvania is also home to vast cultural resources among a varied mix of communities.
- The Commonwealth is home to 121 state parks encompassing nearly 300,000 acres, 2.2 million acres of managed forest land, 1.5 million acres of state game land, 19 national parks, and seven National Heritage Areas.
- Forests blanket more than 60 percent of the state, providing incalculable environmental benefits and providing a wide range of recreational opportunities to Pennsylvanians and tourists.
- Rich soils suitable for farming are another natural resource that characterizes Pennsylvania, has shaped its history, and has ongoing transportation implications for both access and protection.
- In 2020, visits to Pennsylvania's public lands increased by 26 percent, soaring to 47 million and helping to fuel the state's $46 billion tourism industry—and providing vital physical and mental health benefits for Pennsylvanians during the COVID-19 pandemic and associated restrictions on indoor activity.
- The state's forestlands supply the economy with $21.5 billion annually in forest products.
- Pennsylvania is a water-rich state with approximately 85,500 miles of streams and rivers connecting more than 700,000 acres of lakes, bays, and wetlands. According to DEP's 2020 Integrated Report, 25,468 miles of streams in the state were listed as impaired for any use due to prior industrial pollution.
- Pennsylvania's underground resources include natural gas deposits in the Marcellus Shale formation. Advances in gas extraction through hydraulic fracturing led to a boom in natural gas exploration, drilling, pipeline development, and related vehicular movement over the past decade. These activities prompted the enactment of Act 13 of 2012 (Impact Fee). The law established a Marcellus Legacy Fund and allocated a portion of the Marcellus Shale Impact Fee to be distributed to counties on the basis of population for the purpose of replacing or repairing at-risk deteriorated bridges.
Planning Implications
- The aim of transportation entities related to environmental features is to provide appropriate access for the use and enjoyment of these resources while minimizing the harm that transportation facilities and traffic can cause to the environment.
- While PennDOT does not have decision-making authority regarding how land is used, it will continue to work closely with other state, local, and federal agencies to reduce transportation's impacts on the environment. PennDOT's “PennDOT Connects” initiative will need to continue to be used in improving the transportation-land use linkage and ensuring that local partners are engaged as project scopes are being developed.
- PennDOT will also need to continue working with local governments to install and maintain stormwater management systems, an important aspect of protecting the health of the state's waterways.
- Tools such as PennDOT's One Map application that centralizes numerous geospatial data layers, including environmental resources, to be used by the Districts, PennDOT staff, planning partners, and public users must continue to be maintained.
- Federal legislation being considered at the time of this writing is expected to place even greater emphasis on climate change efforts. Because transportation is the primary source of greenhouse gases, it can be expected that over the next five years that air quality and emissions reduction will require even greater attention by transportation agencies and will heavily shape their planning, programs, and investments.
Figure 25: Pennsylvania Environmental Features
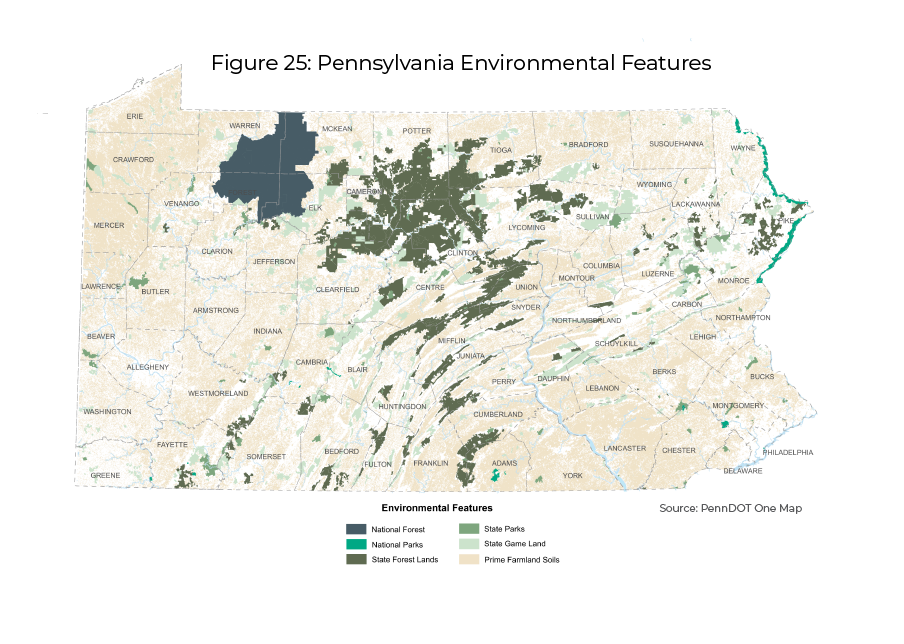
Figure 25 a topographical map of Pennsylvania depicting the environmental features, including national forest, national parks, state forest lands, state parks, state game land, and prime farmland soils from PennDOT One Map.
Additional Opportunities
Federal Policy
In line with increasing federal system performance measures and standards (discussed in the Implementation chapter), federal asset management requirements are shifting the way in which PennDOT prioritizes roadway and bridge repairs. Historically a “worst-first” approach applied available funding to fixing infrastructure that was extremely deteriorated—and thus by necessity deferring minor repairs on roads and bridges that were in better shape. PennDOT is required to establish a Transportation Asset Management Plan (TAMP) that manages assets in a minimal practical cost. PennDOT has applied that approach through the TAMP to establish a lowest life-cycle cost approach. That means making timely minor repairs to newer infrastructure to help it last longer and delay or prevent the need for more expensive rehabilitation or replacement. PennDOT supports this asset management approach. However, absent a funding solution that provides adequate resources, it can be expected that the percentage of non-NHS (lower volume) roads and bridges in poor condition will increase.
Other future opportunities from a national perspective that will likely have a major bearing on Pennsylvania:
- The direction of federal transportation policy as reflected in legislation in November 2021 will be highly influential; as rule-making follows it will likely pose opportunities for honing the strategic direction of this plan and others.
- The federal priority on asset management for highways and public transportation will likely place even greater emphasis on preservation, which is necessary, but could constrain needed capacity-adding investments.
- Climate change, long a matter of debate, is moving now into an era of major initiatives to address the problem. Transportation will be greatly affected. Agencies and planners need to prepare and position for any associated changes to the greatest extent possible.
- The emphasis on active transportation is expected to steadily increase given the positive benefits for public health and community quality of life. Federal and state policy will likely expand this as a focus area.
Modernizing Transportation Funding
Fundamental changes are needed in the way Pennsylvania pays for transportation improvements, maintenance, and other programs: the revenue sources need to be fair and sustainable, and the funding amount needs to be adequate to meet the needs of our vast and aging multimodal transportation system and keep pace with inflation. As of FY 2021-22, it is estimated that PennDOT's $8.8 billion budget would need to more than double to adequately address the Commonwealth's transportation system needs.
Further, approximately 75 percent of PennDOT's highway and bridge funding comes from the federal and state gas tax revenue, which continues to decline. Fuel economy improvements and as well as the transition to alternative fuels and electric vehicles—positive trends in themselves—will continue to reduce gasoline and diesel consumption, and, therefore, the revenue from state and federal fuel taxes. PA Act 44 of 2007 and PA Act 89 of 2013 provided some needed infusions of predictable funding to aid shore up transportation statewide, particularly to the public transportation systems. However, these acts only addressed part of the funding need.
The reductions in travel due to the COVID-19 pandemic —which greatly affected fuel tax revenue and public transportation fare revenue nationwide—worsened the funding situation. Federal COVID-19 relief funding helped keep public transit agencies operational and prevented a complete shutdown of the highway and bridge construction program.
Pennsylvania Governor Tom Wolf established the Governor's Transportation Revenue Options Commission (TROC) by Executive Order in February 2021. The Governor tasked TROC with developing a comprehensive, strategic proposal for addressing the state's multimodal transportation funding needs. In August 2021, TROC submitted its strategic funding proposal for consideration by the Wolf Administration and the Pennsylvania General Assembly. The proposed new and updated revenue sources would close the state-level transportation funding gap in phases. The TROC report also acknowledged the unfunded transportation need at the local government level—$3.9 billion per year, growing to $5.1 billion by 2030—and emphasized the need for mechanisms to expand local and regional investment. The TROC proposal is available at:
https://www.penndot.gov/about-us/funding/Documents/TROC-Final-Report.pdf.
Fundamental changes are needed in the way Pennsylvania pays for transportation infrastructure and services.
Strategic Directions:
Where We Need to Be
Goals and Objectives
- The 2045 LRTP's goals and objectives set a course for PennDOT and its transportation stakeholder and partner organizations to carry out their respective programs with the long-term direction in view.
- Transportation planning is an ongoing process used to shape future policies, investments, and priorities associated with moving people and goods.
- Goal statements express what is essential to accomplish over the planning horizon. The goals align with national planning priorities and requirements, while also reflecting concerns and opportunities expressed by MPOs/RPOs, local governments, and the general public.
Goal A: Safety
Enhance safety and security for both motorized and non-motorized modes throughout Pennsylvania's transportation system.
Promoting safety—reducing the number of crashes, injuries, and fatalities on the transportation system—is an overarching goal and central to PennDOT's mission. Security involves strengthening the system against criminal and terrorist activity to protect people, physical assets, and information technology systems.
Infrastructure design, management, and maintenance are major factors in enhancing safety, but do not solve issues such as dangerous driving behavior. The reduction of fatalities and serious injuries on Pennsylvania's roads requires systematic efforts and the cooperation of many organizations—public, private, non-profit, and educational—as well as individual responsibility.
Further reinforcing PennDOT's commitment to safety are federal performance standards that require regional and statewide safety data tracking and systematic progress toward improvement targets.
PennDOT is currently updating its 5-year Strategic Highway Safety Plan (SHSP), to be completed in December 2021. The plan will identify and evaluate promising practices that promote responsible driver behavior.
Looking ahead, safety planning is changing rapidly as we prepare for connected and automated vehicles, and will address issues such as distracted driving but introduce other challenges. In terms of security, all areas of life are seeing increased vulnerability to cyberattacks; thwarting such activity to safeguard our transportation system is as important as reducing physical crashes on our highways.
Safety planning is changing rapidly as we prepare for connected and automated vehicles, address the many dimensions of distracted driving, and other challenges.
Safety Objectives
- Continue to promote behavioral change through existing educational initiatives with partners and stakeholders that encourage safe habits for users of all modes.
- Reduce the rate and frequency of fatal and serious injury crashes for all modes of travel.
- Expand the collection of transportation safety data and explore funding sources for safety and data analysis for use in systemwide planning, programming, project development, and project delivery.
- Strengthen security across transportation modes in collaboration with public and private stakeholders.
Related Progress and Performance Measures
- Change in highway fatalities (number and rate)
- Change in serious injuries (number and rate)
- Change in non-motorized fatalities and serious injuries
- Change in number of work zone crashes
- Change in Airport Hazard Zoning compliance
- Total number of at-grade rail crossings eliminated
Goal B: Mobility
Strengthen transportation mobility to meet the increasingly dynamic needs of Pennsylvania residents, businesses, and visitors.
Mobility means the relative ease with which people and goods are able to reach their destinations. It reflects a well-developed system with roadways ranging from limited-access highways to local streets to provide system access as well as swift travel. Mobility includes mode choice and convenient connections between modes, which helps provide flexibility in cases of disruptions or changing demand. Mobility considers the distinct challenges of both urban and rural populations, and ensures the system is usable for people of all abilities. It addresses congestion to keep traffic—including freight—flowing smoothly while keeping our communities great places to live.
Our transportation network of roads, bridges, public transportation, airports, rail, and waterways was developed over decades to provide a high level of mobility. The billions of dollars invested in Pennsylvania's transportation network make it possible for most residents to access employment, healthcare, education, shopping, and many other destinations and purposes.
Over the 20-year planning horizon we will need to adapt to changing travel patterns as well as public demand for more mode choice. This LRTP goal emphasizes the dynamic nature of user needs. As such, PennDOT, its planning partners, and others will be challenged like never before to align transportation facilities, services, and programs to the mobility requirements of the public, a changing economy, and technological change.
Mobility Objectives
- Continue to improve system efficiency and reliability.
- Continue to improve public transportation awareness, access, and services throughout Pennsylvania.
- Provide and prioritize multimodal transportation choices to meet user needs, expand mobility options, and increase multimodal system capacity and connectivity.
- Implement regional transportation, land use standards, and tools that result in improved multimodal coordination and complementary development.
- Adapt to changing travel demands, including those associated with e-commerce and post-COVID-19 pandemic changes.
- Work with private sector partners to establish data standards for mobility services and their applications (e.g., Uber and Lyft, carsharing services, bikeshares, etc.).
Related Progress and Performance Measures
- Incident clearance time
- Transit ridership change
- Keystone Corridor ridership change
- Congestion/Travel Time
- Travel time reliability
- Rate of Interstate/Non-Interstate reliability
- Progress – local traffic signal evaluation improvement
Goal C: Equity
Improve transportation access and equity throughout Pennsylvania
Our infrastructure investments and policies have not always been aligned to address racial inequities, impacting generations of people of color and posing challenges in mobility and access for minority communities that persist. Equity also has rural and other dimensions as well. In a transportation context, access and equity refer to a system that is fair, accessible, and useful for everyone, regardless of location, race, physical ability, income level, age, or other geographic or demographic characteristics.
Our nation and our state have high levels of transportation access that would have been unimaginable to previous generations. Nevertheless, transportation barriers remain. The social unrest of 2020, concurrent with the stress of the COVID-19 pandemic, underscored that many issues remain related to diversity, equity, and inclusion that must be addressed. Transportation has an essential role in making such advances.
According to the Transit Cooperative Research Program report Critical Issues in Transportation 2019, nearly 17.5 million workers live in households that lack cars or have more workers in the household than vehicles. Nearly 40 million Americans have some form of disability, almost 16 million of whom are age 35 to 64. All of these equity issues are compounded in urban and suburban areas with limited public transportation and rural areas that lack public transportation entirely. Moreover, the population is aging: the 49 million citizens currently over age 65 (15 percent of the population) will increase to 73 million (21 percent of the population) by 2030.
We must endeavor to make steady improvement with our partners and stakeholders to systematically understand the extent and specific dimensions of access and equity issues and take actions to alleviate the problems. This is not only a social ideal, but is also a practical investment—the benefits of connecting people with jobs and healthcare far exceed the costs.
Equity Objectives
- Evaluate transportation equity issues and opportunities across Pennsylvania.
- Develop measurable goals and metrics for equitable transportation in collaboration with key stakeholder groups.
- Establish equity and access strategies in partnership with stakeholder organizations and groups that advance the identified measurable goals.
- Improve equity and accessibility through ADA improvements and modal choice.
- Develop education, awareness, and training initiatives that strengthen transportation professionals' knowledge and skills to effectively address equity issues and opportunities.
- Implement and support public transportation initiatives for affordability, reliability, and availability for the transit-dependent population.
Related Progress and Performance Measures
- Equity task force established
- Transportation Equity Summit convened and extent of follow-up
- Extent of recommendations acted upon from PennDOT's "Dismantling Systemic Racism and Inequity" (DSRI) report
- Number and percentage of ADA-accessible stations along Keystone Corridor
- Extent of diversity on transportation advisory bodies over time (e.g., STC, TAC, Municipal Advisory Committee, modal advisory boards, regional transportation advisory committees and boards)
Goal D: Resilience
Strengthen Pennsylvania transportation's resilience to climate change and other risks and reduce transportation's environmental impacts.
FHWA defines resilience as “the ability to anticipate, prepare for, and adapt to changing conditions and withstand, respond to, and recover rapidly from disruptions.” In Pennsylvania, the top transportation system resilience concerns are flooding, rock and mud slides, and the results of other severe weather events such as winter storms. Accidents such as hazardous materials releases and bridge strikes can also cause sudden and serious disruptions.
Resilience also applies to dramatic transportation fluctuations wrought by pandemics or other crises, either global or on a smaller scale. The economic and social costs of transportation system disruption are widely recognized and demonstrate that a proactive approach to resilience is a wise investment.
Nationally, policy changes and technological advances may help our transportation system minimize damage, adapt, and be restored quickly after a disruption. As a backdrop to such broader change, transportation system operators of all modes will find themselves having to advance resiliency strategies and address other potential risks. Integration of risk assessments and resilient design procedures will continue to be a focus for long-term planning.
Resiliency is a growing issue nationally. FHWA carries out a vital coordination role including its Resiliency research program. The national objectives for that program underscore the importance of including resiliency as a LRTP goal. The national objectives address tools and techniques for addressing resiliency issues related to severe weather, fuel efficiency, and energy security.
Resilience Objectives
- Employ resiliency measures/actions to ensure long-term system stability.
- Evaluate projects for their expected climate change and resiliency impact and implications.
- Improve environmental stewardship during and before project construction.
Related Progress and Performance Measures
- Emissions reduction
- Average incident clearance time
- Average incident influence time
- Weather impacts mitigation capabilities over time
- Percentage of recycled pavement over time
- Number of electric vehicle charging stations over time
Goal E: Performance
Improve the condition and performance of transportation assets.
Transportation assets in Pennsylvania include not only roadways and bridges but other modal transportation elements such as city buses and rail stations. The challenge in keeping infrastructure in a state of good repair and performing as designed is the disconnect between the scale and age of Pennsylvania's infrastructure and its level of funding over the past many decades (discussed under Goal F: Resources). Pennsylvania's transportation system is more extensive and older than most states, and the transportation system is presently in great need of repair and improvement.
Asset management is a top priority nationally and for PennDOT. It is defined as a series of well-timed preservation activities that extend the life of an asset such as a bridge, maintain the asset at a higher performance level for longer, and lower the total cost of improvements over the asset's life-cycle.
FHWA and the Federal Transit Administration have promulgated asset management regulations to advance national policy for achieving and sustaining a state of good repair for all transportation assets. PennDOT has made great strides with asset management over the past decade. The performance objectives are geared toward building on the progress to date across partners, modes, levels of government, etc.
Performance Objectives
- Leverage technology, operations enhancements, and skill building to improve transportation system efficiency.
- Continue to integrate enhanced asset management approaches and methods with project planning and programming.
- Enhance the availability and quality of real-time travel information, especially in emergency and inclement weather events and for construction/work zones.
- Expand and/or build upon existing technical assistance and education to local communities and MPOs/RPOs.
- Identify potential new public transportation performance measures including value-based, quality-of-life measures demonstrating the difference public transportation makes in the lives of people, including access to employment.
Related Progress and Performance Measures
- Percentage of NHS Interstate pavement in good condition/poor condition
- Percentage NHS Non-Interstate pavement in good condition/poor condition
- Percentage total bridge deck area in good and/or poor condition
- Development of outcome-oriented Transit Performance Measures
Goal F: Resources
Structure transportation funding and finance approaches that allocate sufficient resources for system safety, maintenance, preservation, and improvement.
The LRTP is developed to guide project programming decisions for the Commonwealth for a 20-year planning horizon. However, the plan's goals cannot reasonably be achieved without sufficient resources for repairing and improving the transportation system—all modes.
Governor Tom Wolf's establishment of TROC by a February 2021 executive order (https://www.penndot.gov/about-us/funding/Pages/TROC.aspx) reflects that the funding need is great and that we are at a crossroads in generating the resources to keep the system in a state of good repair. Our transportation funding and finance system, heavily reliant on gas taxes, is increasingly antiquated in light of various factors, including the increasing adoption of electric vehicles.
While finances are the most critical resource need, this goal also considers staff knowledge and skills needed organizationally to meet present and future transportation challenges and opportunities. This will place a steadily increasing premium on professional development, skills-building, and enhanced partnering and collaboration for knowledge-sharing—especially in light of resource constraints.
Resources Objectives
- Advance a multimodal and state-local funding strategy to ensure that resource levels are sufficient to meet transportation system needs.
- Adapt to and position for accelerating change (e.g., mainstreaming innovation, institutional adjustments, people skills, and knowledge management).
- Streamline planning and public involvement processes.
- Improve planning and analytical tools to adapt to changes impacting transportation, including the implementation of a data repository and information exchanges within PennDOT (between Bureaus/Divisions, between Central Office and Districts, etc.).
Related Progress and Performance Measures
- TROC strategic funding proposal implemented in its entirety or modified
- TROC annual funding targets – extent to which targets are being achieved
- Extent and variety of public-private partnerships across modes
- Qualitative assessment of mileage-based user fee (MBUF) preparation and readiness
- On-time, on-budget project delivery rate
- Establishment of asset management training for Districts and MPOs/RPOs
- PennDOT Connects progress and results as reflected in periodic progress reports
Implementation: How We Will Get There
Overview
Implementation is about putting the 2045 LRTP to work—translating Pennsylvania's desired big-picture, long-range transportation direction into real, tangible progress over the next five years. At that point the LRTP will be updated to adjust to changing conditions.
The overarching principles for plan implementation are:
- Accountability
- Flexibility and adaptation
- Information-sharing, especially in support of stakeholder collaboration
- Strengthening the Planning–Programming–Performance linkage
Actions and Accountability
PennDOT will create, maintain, and periodically update an Action Plan that includes the strategic actions and initiatives for advancing the goals and objectives covered in the previous section. Actions are defined at a level to be assigned, scheduled, tracked, and collaborated on with partners and stakeholders.
For this 2045 LRTP update, the Action Plan was developed and refined primarily through “in-reach” meetings with a cross-section of PennDOT managers and program leaders. Broad involvement in shaping the Action Plan ensures that the actions consider and appropriately reflect work that is already underway or planned. It also builds ownership of and commitment to the Action Plan by those on the front lines of implementation.
Certain LRTP actions sustain initiatives already ongoing at PennDOT, such as continuing efforts to enhance work zone safety. Other LRTP actions double-down on initiatives that require more emphasis, such as expanding PennDOT's contingency planning and preparations for weather-related and other emergencies. Some LRTP actions line up PennDOT to meet longer-range needs, such as training the next generation of the state's workforce in areas related to traffic operations and connected and autonomous vehicles. Other actions are important first steps in understanding needs, such as efforts related to assessing transportation equity issues across the state.
The Action Plan includes various progress indicators and performance measures. The plan and associated progress will be reviewed twice a year and reported on annually to PennDOT leadership. Basic summaries of plan implementation progress will be provided to the STC, TAC, and other stakeholder groups such as the Planning Catalyst Team, which served as a steering committee for LRTP development.
PennDOT's Program Management Committee will conduct periodic reviews of the Action Plan and specific goals, objectives, and initiatives aimed at maximizing and optimizing plan implementation.
Pennsylvania Local Government: A Timely Strategic Alliance
As part of the LRTP's development, PennDOT facilitated a series of plan development workshops with four Pennsylvania local government associations. Each workshop included association leadership, staff, and a cross-section of their members. The objective for the workshops was to identify and prioritize planning issues from the local perspective.
Clearly, with challenges and opportunities such as improved transportation and land use planning the time is uniquely opportune for this collaborative long-range planning and plan implementation focus. Local government is key to and an asset for the implementation of the Long-Range Transportation Plan and the Freight Movement Plan as well.
After the four workshops, a joint session was also held to review the results and to identify those topics and issues most promising for collaboration through the implementation of the plan.
State-local collaboration efforts will be periodically identified for PennDOT and local government collaboration, along with MPO and RPO participants, starting with calendar year 2022.
Implementation Partners and Projects
The LRTP represents Pennsylvania's highest-level transportation plan—setting the broad long-term directions as an overall compass for project investments, program and service delivery, and other initiatives, and supporting compliance with federal planning requirements. PennDOT's Office of Planning will oversee various efforts to ensure that there is a coordinated effort to acknowledge the LRTP within:
- PennDOT's Strategic Plan
- Modal plans
- Functional plans – technology, asset management, etc.
- Regional LRTPs and freight plans
- Regional modal plans such as public transportation plans
The LRTP will be implemented in collaboration with PennDOT's various regional partners (Figure 24). This promotes collaboration, joint problem-solving, and resource optimization. Specific projects such as a roadway widening or bridge replacement are identified, prioritized, and programmed (placed on a list of funded projects) at the regional level by MPOs and RPOs. They develop regional LRTPs with project lists and establish Transportation Improvement Programs (TIPs)—the list of funded projects expected to be undertaken within the next four years. These regional efforts should generally align with the statewide direction but not be prescribed by a centralized approach. This recognizes the necessity and practicality of customized solutions for each of Pennsylvania's unique regions.
Pennsylvania has a long history of working effectively as partners with the Federal Transit Administration, the Federal Aviation Administration, and the Federal Railroad Administration. The multimodal emphasis of the LRTP and the Freight Mobility Plan puts further light on the importance of this intergovernmental collaboration. In fact, the federal partner in the federal–--state–--local system will play a key role in implementing the 2021 Infrastructure Legislation and associated program changes and rule-making.
The State Transportation Commission and the TYP that it approves are key to the plan's implementation. The STC also oversees the issuance of the Transportation Performance Report, which will take on greater significance as this LRTP advances the greater integration of planning, programming and performance measurement.
Broad state direction is provided through financial guidance to help guide program development by MPOs and RPOs. This helps to ensure a generally consistent procedural approach statewide—again without being project-prescriptive. It is anticipated that future financial guidance will incorporate the direction of the LRTP as part of the overall framework. In a similar manner, PennDOT uses the goals and objectives of the LRTP to help frame its longer-term budgetary and financial horizon planning.
Project selection is also shaped by transportation performance management targets, described in the following section.
The level and range of transportation staff participation in the early development of the LRTP Action Plan will translate into momentum for implementation.
Figure 26: MPO and RPO Planning Regions
.png)
Figure 26 is a state map of Pennsylvania illustrating the MPO and RPO planning regions and the independent county, Wayne County.
Transportation Performance Management
Ultimately, plan implementation success is measured by how well the transportation system works. Measures of various aspects of system performance in turn guide future planning and project investments to ensure Pennsylvania is making progress toward its goals.
Transportation performance management (TPM) is a federally required approach to prioritizing transportation investment that is focused on results—measurable, strategic improvements to the transportation system.
TPM involves setting measurable performance goals for the transportation system, tracking progress, and directing funds to projects that best achieve those goals. In a funding environment where needs consistently exceed available funding, a TPM approach is essential to maximize the benefits of every dollar spent.
The federal government established TPM requirements in its transportation funding legislation. Both the Moving Ahead for Progress in the 21st Century Act (MAP-21) and the Fixing America's Surface Transportation (FAST) Act include performance management requirements to ensure that federal transportation funds are invested efficiently toward achieving national goals. The United States Congress established the following national performance goal areas:
- Safety
- Infrastructure condition
- Congestion reduction
- System reliability
- Freight mobility
- Environmental sustainability
- Reduced project delivery delay (getting roadway and other improvements built faster)
FHWA was responsible for determining a way of measuring current conditions and progress toward each of those goals. FHWA established the national transportation performance measures shown below.
National Transportation Performance Measures
- Pavement condition on the Interstate and Non-Interstate National Highway System (NHS)
- Performance (system reliability) of the NHS
- Freight movement on the Interstate system
- Bridge condition on the NHS
- Fatalities and serious injuries, both number and rate per vehicle-mile traveled, on all public roads
- Traffic congestion
- On-road mobile source emissions
The national TPM approach is implemented through the states and their regional and local partners. Pennsylvania has long utilized a comprehensive planning and programming process, with a focus on collaboration among PennDOT, FHWA, and Planning Partners at the county and regional levels. This foundation is used to implement TPM and Performance-Based Planning and Programming (PBPP). Performance-based planning aims to make the transportation investment decision-making process both informed and accountable. Key elements of TPM and PBPP include managing performance data, selecting performance targets, monitoring progress in meeting targets, and defining ways to integrate performance measures into the transportation decision-making process.
To support the integration and monitoring of the National Performance Measures, PennDOT produces biennial reports to FHWA documenting progress in meeting defined targets. A Pennsylvania Statewide Dashboard documents performance according to each of the national measures.
PennDOT's Bureau of Public Transportation is responsible for developing a Transit Asset Management Plan (TAM Plan) and establishing performance targets to meet FTA performance measurement requirements. Targets are set for the measures of rolling stock, equipment, and facilities and account for asset age and baseline condition. Progress toward transit performance targets is updated on an annual basis based on prior year performance and anticipated funding availability. PennDOT's Transit Asset Management Plan provides more information.
Through the STC, PennDOT produces a biennial Transportation Performance Report (TPR) on progress made in safety, mobility, preservation, accountability, and funding. This report card provides an assessment of performance ratings and recent trends for each of the measures. Information and insights from these measures are used to inform the statewide LRTP goals, objectives, and actions. They are also used to inform the development of PennDOT's 12-year and 4-year programs (TYP and STIP, respectively). PennDOT continues to enhance methods to track and share statewide transportation performance. The LRTP will be used to modify the performance measures in future iterations of the TPR.
PennDOT continues to work with regional and local partners to improve ways to apply TPM. PennDOT has developed PBPP Procedures and Procedural Guidance for the development of the regional MPO/RPO TIPs. This includes formalizing methods to directly consider the performance measures in project identification and prioritization.
For long-range planning, PennDOT continues to support the MPOs and RPOs with the integration of performance measures into each of their LRTPs. PennDOT works with MPOs/RPOs to ensure their LRTP:
- Describes the performance measures and performance targets used in assessing the performance of the transportation system.
- Includes a System Performance Report that (1) evaluates the condition and performance of the transportation system with respect to performance targets, and (2) documents the progress achieved by the MPO/RPO in meeting the targets in comparison to performance recorded in past reports.
- Integrates the goals, objectives, performance measures, and targets described in all the plans and processes required as part of a performance-based program.
PennDOT has also launched development of a TPM Resource Toolbox to support PennDOT and MPOs/RPOs with the integration of the federal performance measures into the transportation planning process. The toolbox includes Q&A channels; handouts with guidance on TPM implementation, best practices, and case studies; and ideas for communicating the TPM measures to the public. The TPM Resource Toolbox is regularly updated based on the needs and questions of PennDOT and planning partner staff.
The LRTP will be useful in updating the performance measures of the Transportation Performance Report. New measures may result from this plan.
Implementation Resource: Transportation Planning Data Repository
PennDOT, its stakeholders, and its partner MPOs and RPOs use a variety of data to forecast and plan for future transportation system needs and priorities. PennDOT is working to develop a data repository to aid and support MPOs/RPOs and stakeholders statewide. The effort is aimed at identifying the best available data sources, processing data into easy-to-use products, sharing data in an organized manner, and updating the data on a periodic schedule. Initial efforts will focus on data that can support solutions to our most frequently asked transportation planning questions.
Some of the most important data needs relate to infrastructure (bridges and pavement), freight, and land use. PennDOT has already initiated efforts to develop data products that help address planning questions across these topic areas. This includes developing maps highlighting the density of employment by employment type. Other priority data products (referred to as the “Core Metrics”) will focus on better understanding the national transportation performance measures and mapping of innovative data sources such as cellular and GPS travel time and origin–destination data. The Bureau of Public Transportation's Capital Planning Tool (CPT) is still yet another planning tool provided by PennDOT.
The data repository is envisioned to be an evolving resource that will address new data sources and changes to our future transportation planning needs and questions. It is anticipated to become available to the state's MPOs and RPOs in 2022, and will be an important resource for regional planning and LRTP implementation.
Key Elements of the PennDOT Data Repository Initiative
- Assess available data and measures
- Define topic areas to address
- Identify most important questions for each topic area
- Invest resources; process data; define form of product
- Develop process to produce and integrate data into PennDOT platforms
- Develop schedule for data updates
Data Categories to be Addressed by PennDOT's Data Repository
- Freight
- Infrastructure
- Traffic Demand
- Travel Time
- Land Use
- Origin-Destinations
- Transit
- Active Transportation
- Safety
- Equity
- Air Quality
- Tourism-Recreation
Glossary
12-Year Program (TYP) – PennDOT’s listing of statewide transportation projects over a 12-year period; guided by the goals of the LRTP and updated every two years.
Active Transportation – Any non-motorized mode of transportation, including bicycling, walking, or wheeling.
Airport Hazard Zoning – Zoning regulations required by Pennsylvania Act 164 entitled the “Airport Zoning Act”; required adoption by local municipalities within an airport hazard area to maintain compatible neighboring land uses and to protect the safety of pilots, aircraft, people, and property.
Americans with Disabilities Act (ADA) of 1990 – A civil rights law that prevents discrimination of individuals with disabilities in employment, transportation, communications, access to government services, and other public accommodations.
Asset Management – Defined by FHWA as a strategic and systematic process of operating, maintaining, and improving physical assets, with a focus on both engineering and economic analysis based upon quality information, to identify a structured sequence of maintenance, preservation, repair, rehabilitation, and replacement actions that will achieve and sustain a desired state of good repair over the life-cycle of the assets at minimum practicable cost.
At-Grade Railroad Crossing – An intersection where a highway crosses railroad tracks at the same level.
Bike-shares – A shared transportation service in which bicycles are made available for shared use to individuals on a short-term basis for free or at low cost.
Bridge Asset Management System (BAMS) – PennDOT software that assists both engineers and planners by providing a recommended list of projects, based on individual or regional input and needs, in accordance with federally mandated lowest life-cycle cost (LLCC) methodology. Bridge condition forecasts are generated over 12 years based on current condition data housed in PennDOT databases and the improved conditions expected as a result of future projects.
Bridge Deck – The roadway or walkway surface of a bridge.
Carsharing – An on-demand, membership-based shared vehicle service that allows a driver to rent a vehicle for short periods of time as needed (usually hourly or daily).
Commercial Service Airport – Defined by the Federal Aviation Administration as a publicly owned airport that receives scheduled passenger service and has at least 2,500 passenger boardings each calendar year.
Connected and Automated Vehicles (CAV) – Connected vehicles enable safe, interoperable communications among vehicles, roadside infrastructure, and others. Automated vehicles have varying capability levels, ranging from no automation to full driving automation. Definitions for all automated vehicle levels and additional information on CAV can be found in the Pennsylvania Automated Vehicle Strategic Plan.
Dismantling Systemic Racism and Inequity Report (DSRI) – A report developed by PennDOT in 2021 to assess internal diversity and inclusion efforts, understand structural racism in transportation generally, and evaluates programs and initiatives in which PennDOT can achieve greater equity.
E-commerce – Commercial transactions conducted electronically on the Internet.
Equity – The fair distribution of impacts (benefits, costs) and resources. In transportation, it means providing affordable, accessible, and inclusive transportation services and programs and creating and supporting a quality transportation system that works for everyone
Essential Air Service (EAS) – A program enacted by the U.S. government that maintains commercial air service in small communities affected by the Airline Deregulation Act of 1978. Without EAS, residents of small communities would have to spend many hours to access a larger, “hub” airport for travel, medical care, and other services..
Federal Highway Administration (FHWA) – Federal agency responsible for overseeing the use of Federal funds for a variety of roadway, bridge, and other transportation programs; One agency of the U.S. Department of Transportation.
Fiscal Year – a one-year period, commonly used by governments and companies for financial reporting and budgeting. The federal fiscal year is October 1 through September 30.
Fixing America’s Surface Transportation (FAST) Act – The federal transportation reauthorization bill passed by the Obama Administration in 2015; authorized over $305 billion to fund surface transportation programs across fiscal years 2016 through 2020.
Fixed-Route Transit – Defined by the Federal Transit Administration as services provided on a repetitive, fixed schedule basis along a specific route with vehicles stopping to pick up and deliver passengers to specific locations; each fixed route trip serves the same origins and destinations.
Intelligent Transportation Systems (ITS) – A broad range of wireless and traditional communications-based information and electronic technologies that advance transportation safety and mobility through integration into transportation infrastructure and into vehicles.
Interstate Highway System – A continuous network of controlled-access highways in the contiguous 48 U.S. states that serve as part of the National Highway System.
Land Use – The human use of land; a representation of economic and cultural activities (e.g., agricultural, residential, industrial, recreational, mining, etc.) that are practiced in a given place.
Lowest Life-cycle Cost (LLCC) – A process designed to maximize the life of an asset at the lowest cost through a risk-based prioritization of preservation, rehabilitation, and reconstruction.
Metropolitan Planning Organization (MPO) – Planning organizations responsible for regional transportation planning and programming for all modes of transportation in urbanized areas with a population
of over 50,000.
Mileage-Based User Fee – A user charge based on miles driven in a specific vehicle (i.e., cents per mile) as opposed to the current excise tax on fuel consumed, as defined by the Mileage-Based User Fee Alliance.
Moving Ahead for Progress in the 21st Century (MAP-21) Act – The federal transportation reauthorization bill signed into law by President Obama in 2012.
National Highway System (NHS) – A federally-designated highway system that consists of roadways important to the nation’s economy, defense, and mobility. The subsystems of the NHS include Interstates, Principal Arterials, Strategic Highway Network (STRAHNET), Strategic Highway Network Connectors, Intermodal Connectors.
Non-Motorized Transportation – To travel by means other than a motorized vehicle including by foot, bicycle, or horse.
PA Act 44 of 2007 – An act passed by the Pennsylvania legislature in July 2007 that established a framework to assess transit agency performance through a formal review process.
PA Act 89 of 2013 – An act passed by the Pennsylvania legislature in 2013 as a one-time comprehensive transportation funding package, providing $2.3 billion in additional funding for road projects, bridge repairs, and public transportation improvements.
Pavement Asset Management System (PAMS) – PennDOT software that assists both engineers and planners by providing a recommended list of projects, based on individual or regional input and needs, in accordance with federally mandated lowest life-cycle cost (LLCC) methodology. Pavement condition forecasts are generated over 12 years based on current condition data housed in PennDOT databases and the improved conditions expected as a result of future projects.
PennDOT Connects – PennDOT’s approach to enhance local engagement and improve transportation-project planning, design, and delivery. This policy was launched in December 2016 and expands PennDOT’s requirements for engaging local and planning partners by requiring collaboration with stakeholders before project scopes are developed and ensures community collaboration happens early in the process. It certifies that each project is considered in a holistic way for opportunities to improve safety, mobility, access, and environmental outcomes for all modes and local contexts.
PennDOT Districts – PennDOT's eleven field offices throughout the state responsible for administrating project development, design, construction, and maintenance activities within their geographic region.
PennDOT Program Management Committee (PMC) – An administrative group within PennDOT, chaired by the Secretary of Transportation, which includes all Deputy Secretaries, representatives of the District Offices, and the Federal Highway Administration. The Center for Program Development and Management supports this group by developing agendas and making presentations and PMC approval is required to fund and initiate the development of specified phases of a given project.
PennSTART – In Spring 2018, PennDOT, the Pennsylvania Turnpike Commission, and Penn State University partnered to develop PennSTART, a state-of-the-art training and testing facility to address the transportation safety and operational needs of Pennsylvania and the Mid-Atlantic Region. When completed, PennSTART will address safety training and research needs in six key areas: traffic incident management (TIM); connected and automated vehicles; tolling and intelligent transportation systems (ITS) technology; work zones; commercial vehicles; and transit vehicles.
Performance Based Planning and Programming (PBPP) – The Moving Ahead for Progress in the 21st Century Act (MAP-21) and subsequent Fixing America’s Surface Transportation (FAST) Act require State DOTs, Transit Operators, and MPOs to establish and use a performance-based approach to transportation decision making. This includes tracking performance measures, setting data-driven targets for each measure, and selecting projects to help meet those targets. The FAST Act also requires that the TIP include a description of its anticipated effect toward achieving the established performance targets, linking investment priorities to those performance targets.
Performance Measures – Operational characteristics, physical conditions, or other appropriate parameters used as a benchmark to evaluate the adequacy of transportation facilities and estimate needed improvements.
Performance Targets – A quantifiable level of performance or condition, expressed as a value for the measure, to be achieved within a time period.
Private Use Airport – An airport that is accessible to private users only and not open to the public.
Project Delivery – The process that takes a project concept from the planning and programming stage, though the design process (including environmental, utility, railroad, and right-of-way clearances, as required), to the completion of a constructed project
Project Development – The development and implementation of a project and its progress through a number of phases (or stages).
Public-Private Partnership (P3) – A contractual agreement between a public entity and a private entity (or another public entity) in which the public entity transfers the responsibility for engineering, construction, operation, financing, and/or maintenance (or any combination) of a transportation project or facility to the private sector for a defined period of time.
Public Transportation Trust Fund – Created as part of PA Act 44 of 2007 to provide money to transit agencies for capital and operation assistance; funded by sales tax, PA Turnpike funding, other use taxes and fees that are not constitutionally protected for highway funding.
Public Use Airport – An airport that is open to the general public and can be owned publicly or privately.
Rapid Bridge Replacement Program – a program that replaced 558 structurally deficient bridges across Pennsylvania under a design-build-finance-maintain (DBFM) public-private partnership (P3) arrangement between PennDOT and Plenary Keystone Partners.
Real-Time Travel Information – Current travel condition information that can be used to monitor and manage traffic in terms of road safety, congestion, regulatory compliance, and supply chain information.
Regional Operations Plan (ROP) – A plan which lays out the strategic transportation operations program for the region, including specification of regional projects. The program delineated in the ROP is to be implemented and mainstreamed in transportation planning documents and day-to-day activities.
Resiliency – The ability to adapt to, recover from, and respond to—and bounce back quickly from threats to physical infrastructure and operations and threats of cybersecurity, terrorism, and all hazards.
Rural Planning Organization (RPO) – An organization that identifies local transportation needs, conducts planning, assists local governments, and supports the statewide transportation planning process in non-metropolitan regions of the state. RPOs can be designated as a method for formalizing the engagement of officials from areas with a population size less than 50,000 as they incorporate rural transportation needs in the statewide transportation planning process.
Security – Freedom from intentional harm and tampering that affects both motorized and non-motorized travelers, and may also include natural disasters.
State of Good Repair – A condition sufficient for the asset to operate at a full level of performance.
State Transportation Commission (STC) – Established by state law to address transportation program priorities, evaluate and determine the condition and performance of the statewide transportation system, and to set transportation policy direction; consists of fifteen members: the Secretary of Transportation (chairman), the chairman and minority chairman of both the Senate Transportation Committee and the House Transportation Committee; and ten public members appointed by the Governor.
Transportation Advisory Committee (TAC) – A body that advises the Secretary of Transportation and the State Transportation Commission on transportation issues in Pennsylvania, including the determination of goals and the allocation of resources among the alternate modes in the planning, development and maintenance of programs and technologies for transportation systems. The committee which is composed of representatives of government, industry, labor and education, was mandated by PA Act 120 of 1970.
Transportation Revenue Options Commission (TROC) – A commission established by Governor Tom Wolf in March 2021 to investigate comprehensive funding recommendations for Pennsylvania’s transportation network.
Transportation Improvement Program (TIP) – A plan established by the MPOs and RPOs which consists of a prioritized list of projects or project segments to be carried out within the next four years after adoption. It is updated every two years.
Transportation Performance Management (TPM) – A strategic approach that uses system information to make investment and policy decisions to achieve national performance goals.
Transportation Systems Management and Operations (TSMO) – A way to address reliability, mobility, and congestion by implementing various strategies that utilize existing infrastructure; rather than just expanding capacity
Travel Time Reliability – Measurement of unexpected delay; the consistency or dependability in travel times, as measured from day-to-day and/or across different times of the day.
United States-Mexico-Canada Agreement (USMCA) – A free trade agreement between the United States, Canada, and Mexico that went into effect on July 1, 2020 and replaced the North American Free Trade Agreement (NAFTA). The trade deal phased out tariffs on many goods passing between the three countries.
Vehicle Miles Traveled (VMT) – A measure of total travel, by all vehicles.
Acknowledgements
Planning Catalyst Team
Bob Bini, AICP
Lancaster County Planning Commission
Mike Boyer
Delaware Valley Regional Planning Commission
Becky Bradley, AICP
Lehigh Valley Planning Commission
Cecile Charlton
Delaware County Transportation Management Association
Jessica Clark
PennDOT Program Center
Roger Cohen
PennDOT Senior Policy Advisor to the Secretary
Lyndsie DeVito
PennDOT District 1-0
Steve Fisher
PennDOT District 4-0
Jon Fitzkee
Lebanon County Planning Department
Brian Hare, PE
PennDOT Program Center
Robert Henry
GVF Transportation Management Association
Jan Huzvar
PennDOT Press Office
Mike Keiser, PE
PennDOT Acting Deputy Secretary for Highway Administration
Chris King
PennDOT District 3-0
Tom Klevan
Southwestern Pennsylvania Commission
Vanessa Koenigkramer
PennDOT District 5-0
Amanda Leindecker
PennDOT District 5-0
Hugh McGowan
PennDOT Program Center
Emma Pugh
PennDOT District 4-0
Jeff Rai
PennDOT District 5-0
Mike Rebert, PE
PennDOT District 5-0
Shane Rice
PennDOT Policy Office
Michael Rimer, AICP
PennDOT Program Center
David Rostron, PE
PennDOT District 5-0
Karen Russell
PennDOT Program Center
Larry Shifflet
PennDOT Deputy Secretary for Planning
Matt Smoker
Federal Highway Administration
Stephanie Spang
PennDOT District 11-0
Anne Stich
PennDOT District 9-0
Harold Swan
PennDOT District 10-0
Michelle Tarquino
PennDOT Multimodal
Joshua Theakston
PennDOT District 12-0
Mark Tobin
PennDOT Program Center
Nick Mackereth
Department of Community and Economic Development
Scott Vottero, PE
PennDOT District 5-0
Brian Wall
PennDOT Bureau of Planning and Research
Andy Waple, AICP
Southwestern Pennsylvania Commission
Angela Watson, AICP
PennDOT Bureau of Rail, Freight, Ports, and Waterways
Emily Watts
PennDOT Policy Office
Tom Zilla, AICP
Centre Regional Planning Agency